The Complete AI SEO Guide with OptimAI
This AI SEO guide walks through how modern search has shifted - and how OptimAI measures it. AI engines now answer questions your customers used to type into Google. OptimAI is the audit tool built for that shift: we check whether AI engines can extract your content, whether they're actually citing your domain right now, and what they're answering for your target keyword - then hand you a prioritised to-do list of what to fix, why it matters, and how it's prioritised by impact.
Where traditional SEO tools hand you a spreadsheet of metrics, OptimAI scores both halves of modern search in a single scan:
- AI Search Readiness - 40% of your total score, across six dimensions legacy SEO tools don't measure at all: structured data, Q&A patterns, direct answer density, citation worthiness, entity richness, content freshness.
- AI Search Visibility - direct citation checking on Perplexity, OpenAI (ChatGPT) and Google. We ask each engine your keyword and tell you whether, where and how your domain gets cited.
- AI Search Opportunity - reverse-engineers what AI engines are actually answering for your keyword and flags the topics, questions and formats your page is missing.
- Traditional SEO fundamentals - Content, On-Page, Technical and Performance (60% of the total). Everything you'd expect from a serious audit tool, alongside everything the incumbents leave out.
Every suggestion is personalised to the specific page and keyword you scanned. No generic advice, no filler, no "industry best practices" copy-pasted from a template - the scorecard reads your page and tells you what to do about it.
This is the definitive walkthrough of OptimAI, its scoring methodology and why this is the best tool to get your site visible in AI and improve your Google ranking. Every panel, every dimension, every tip worth knowing - plus a real-world example scan of Salesforce's UK product page end-to-end, so you can see exactly how the scorecard reads on a real site.
If you just want the UI tour, skim section 2. If you want to understand the scoring, head to section 3. If you're evaluating Pro tier, section 4 covers everything. For a working rhythm once you're up and running, see section 5.
1. Getting Started
OptimAI is an AI SEO audit tool. Paste a URL and a target keyword, get a 20 dimension scorecard covering how well the page ranks in traditional Google search and in the new generation of AI answer engines (also called Answer Engine Optimization, or AEO). The free trial gives you enough credits for ten full analyses, no card required.
1.1 Logging in
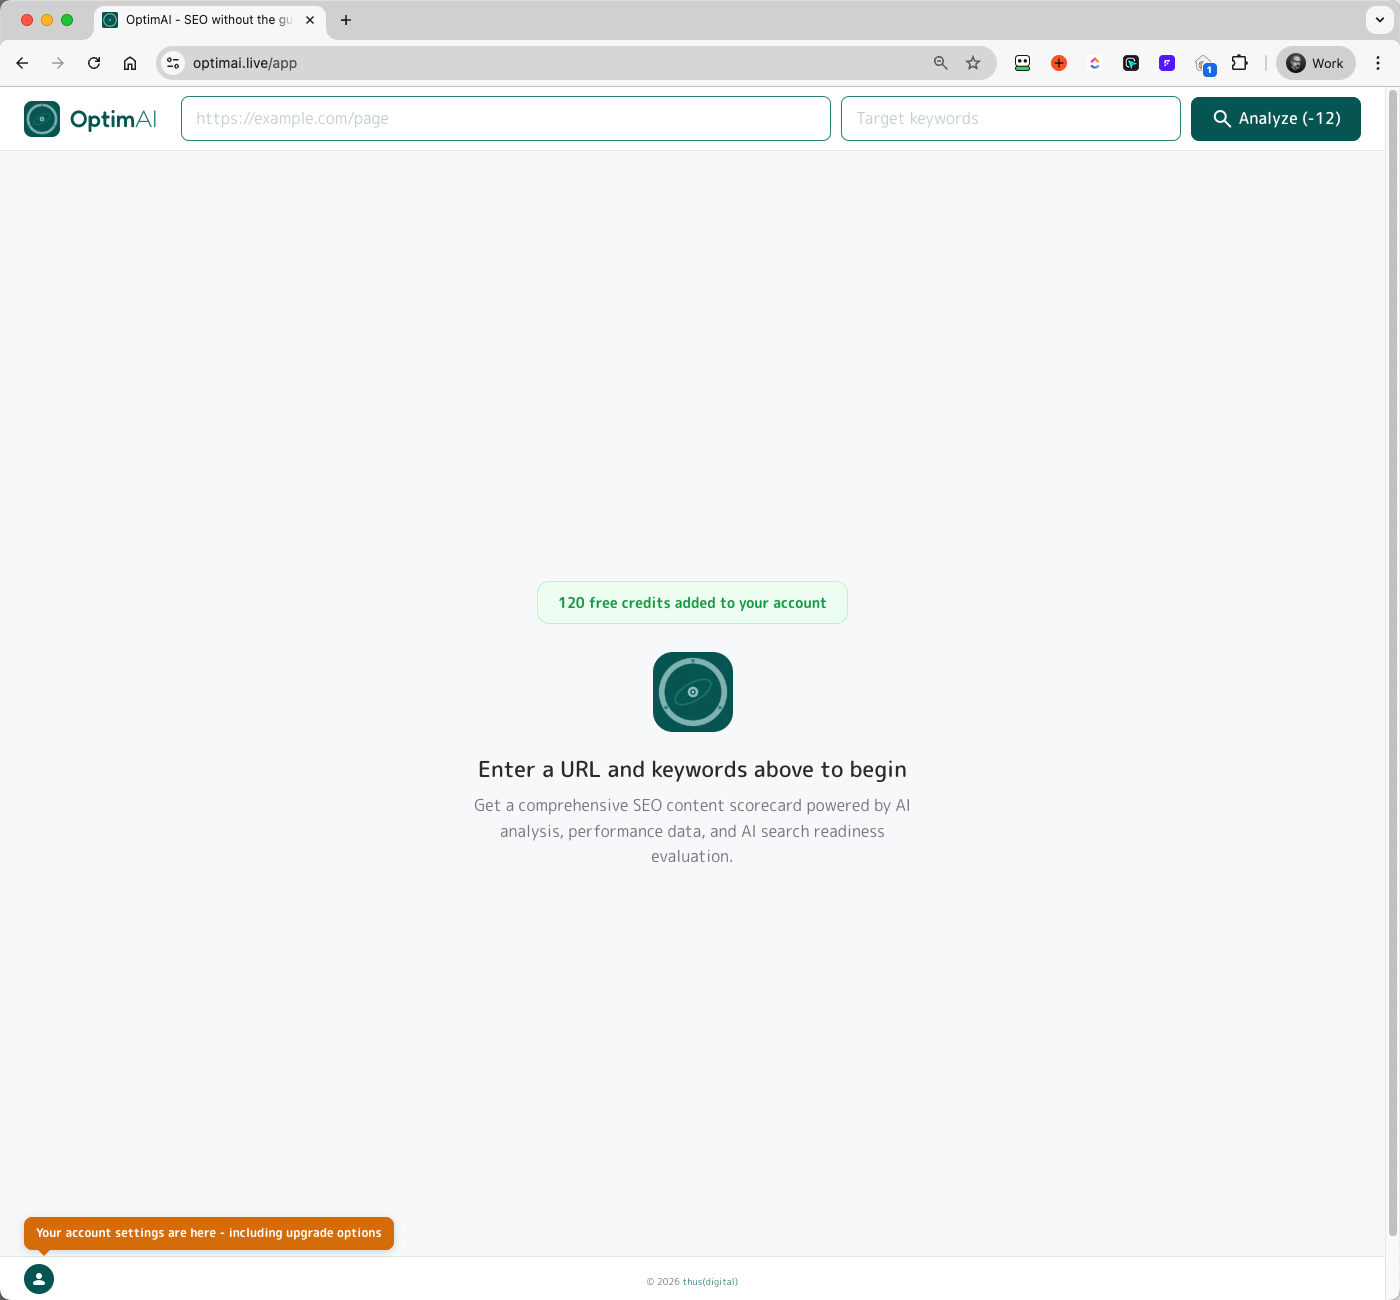
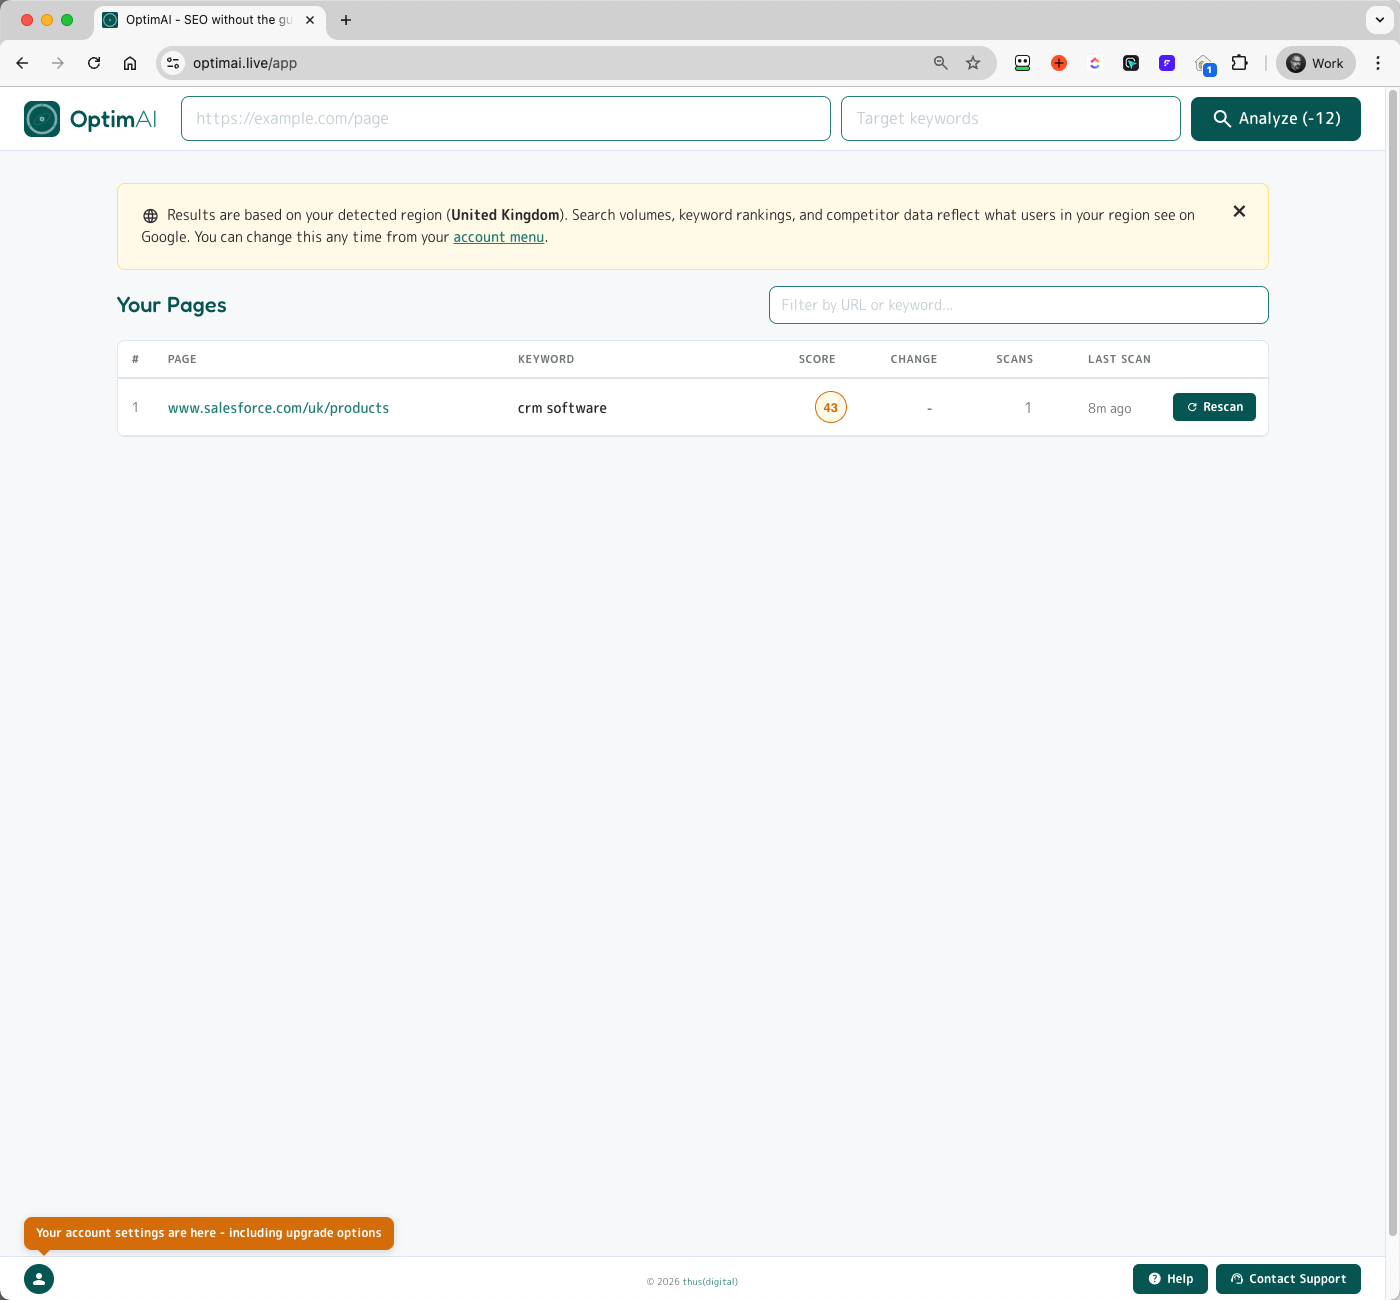
Sign in with Google or Microsoft. A Standard account is created automatically with 120 free credits - enough for ten full analyses. You'll land on the empty dashboard:
- Scan bar - URL field + keyword field + Analyze button (showing the credit cost for the scan)
- Free credits badge - your starting balance
- Empty state - once you run a scan, every scan you ever run will appear in this table
1.2 Run your first scan

Paste a URL. Enter a target keyword. Click Analyze. The Analyze button shows the credit cost dynamically so you always know what you're spending before you spend it.
1.3 Your first report
A scan takes around 45-60 seconds. The report opens automatically when it's done. You get a single long scrollable view broken into sections:
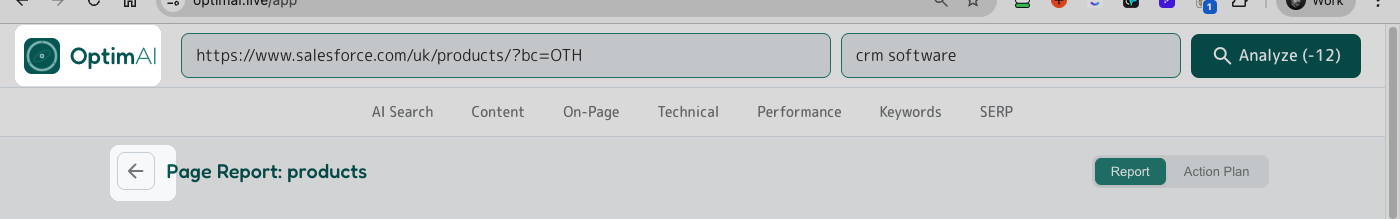
- The scan bar at the top showing the scanned URL + keyword, with a Refresh button (runs a fresh scan at the reduced refresh cost)
- A section nav bar: AI Search / Content / On-Page / Technical / Performance / Keywords / SERP / History - click to jump straight to that section
- The Report / Action Plan tabs top-right - switch between the full report and a todo-list view of every suggestion across every dimension, prioritised by impact
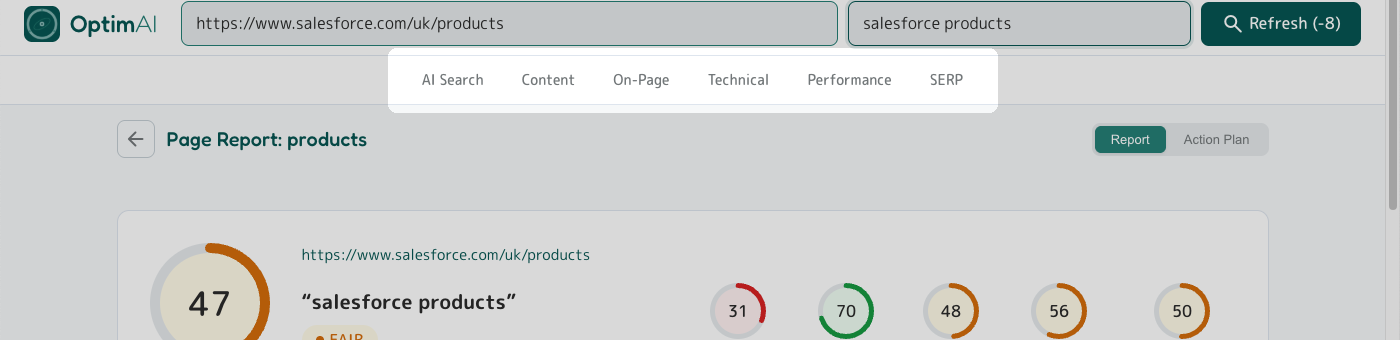
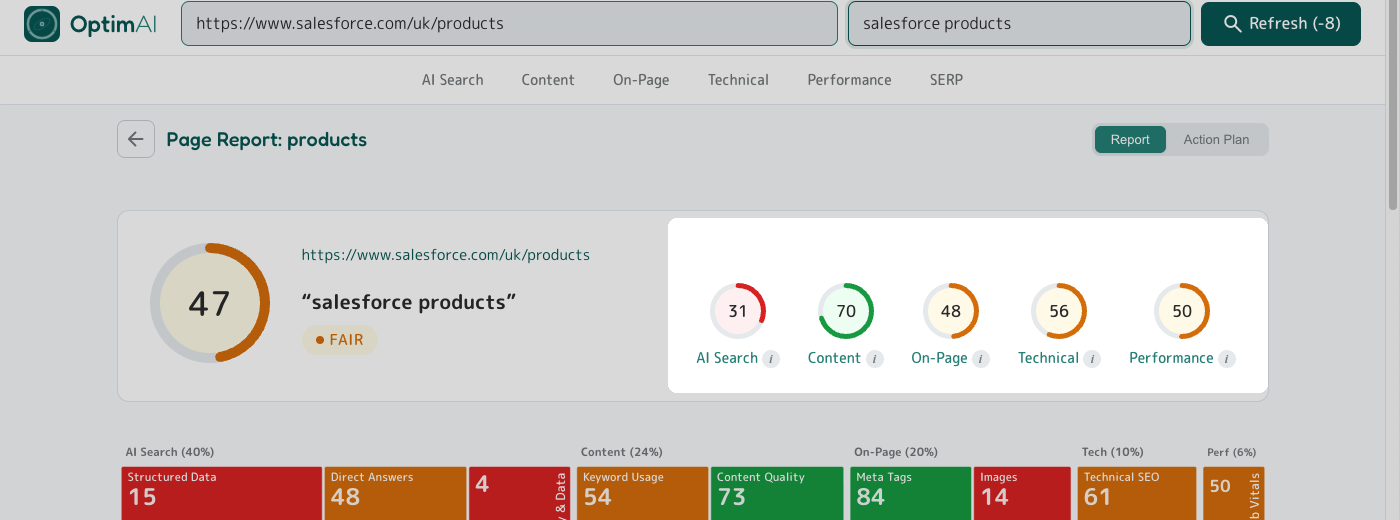
- The top panel with your overall score, five per-category scores, and a dimension heatmap
- Each category section in turn - top panel, per-dimension panels, expandable metrics drawers
- The Download PDF button bottom-right
1.4 Real example explained: Salesforce
If you just want the UI tour, skip to Getting Around. This section walks through a real report end-to-end and is the clearest single view of how to read OptimAI - worth 5 minutes.
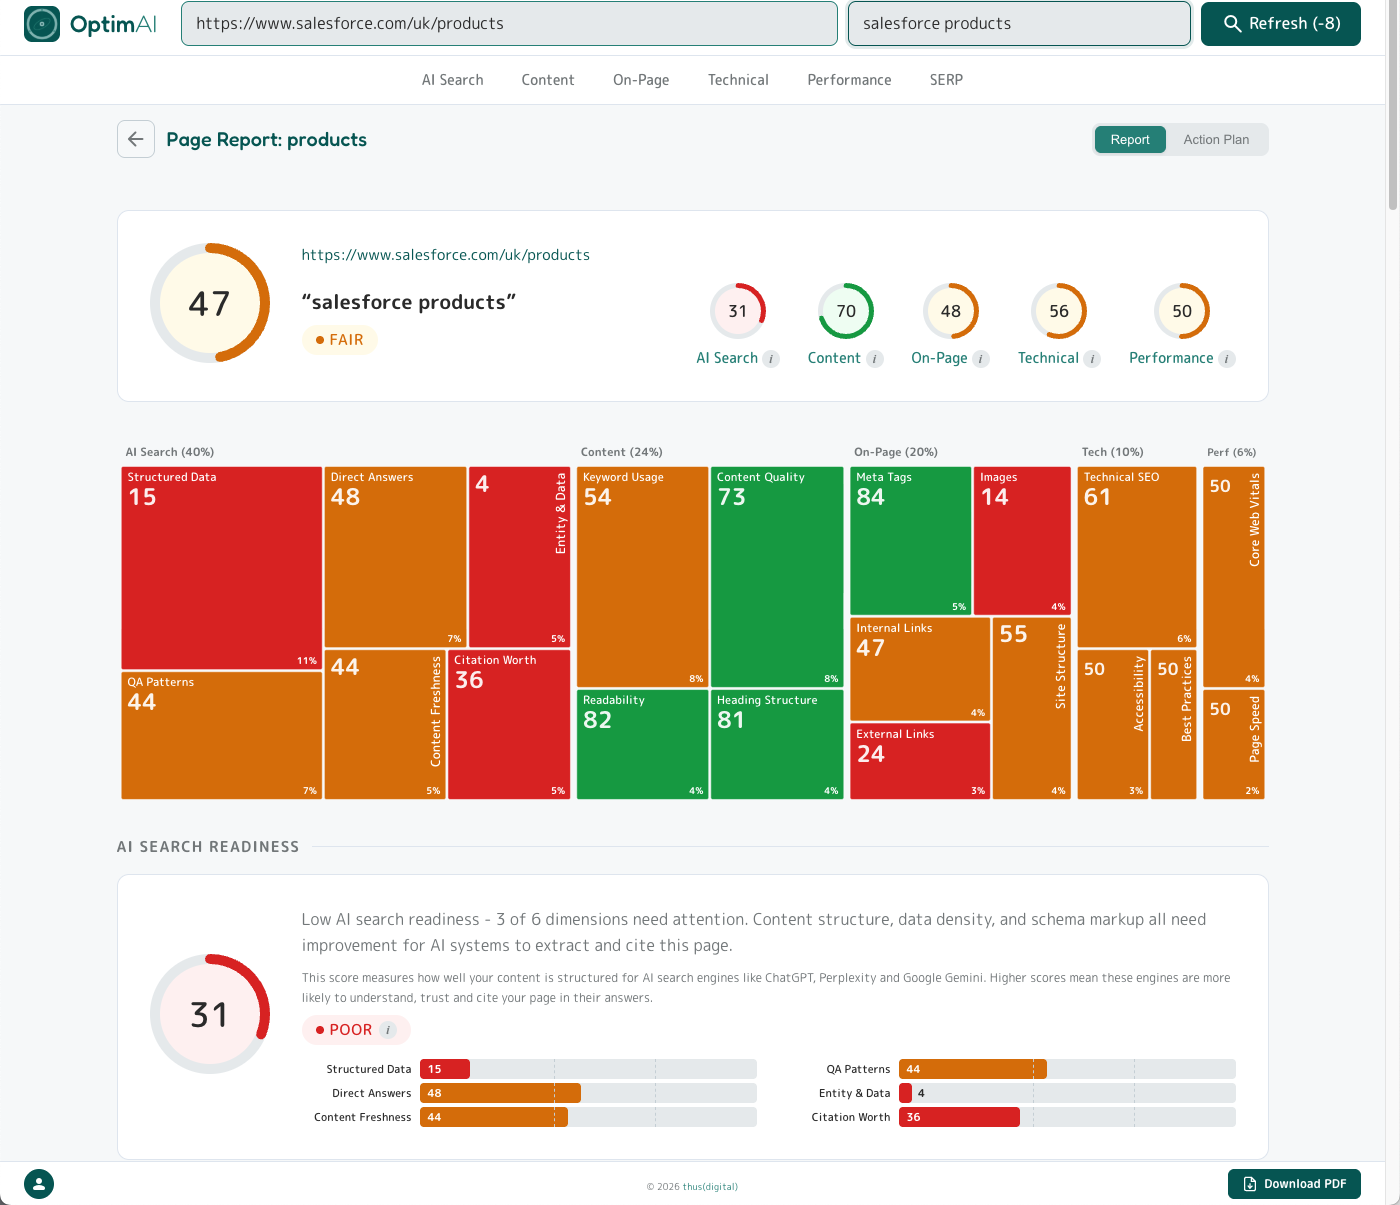
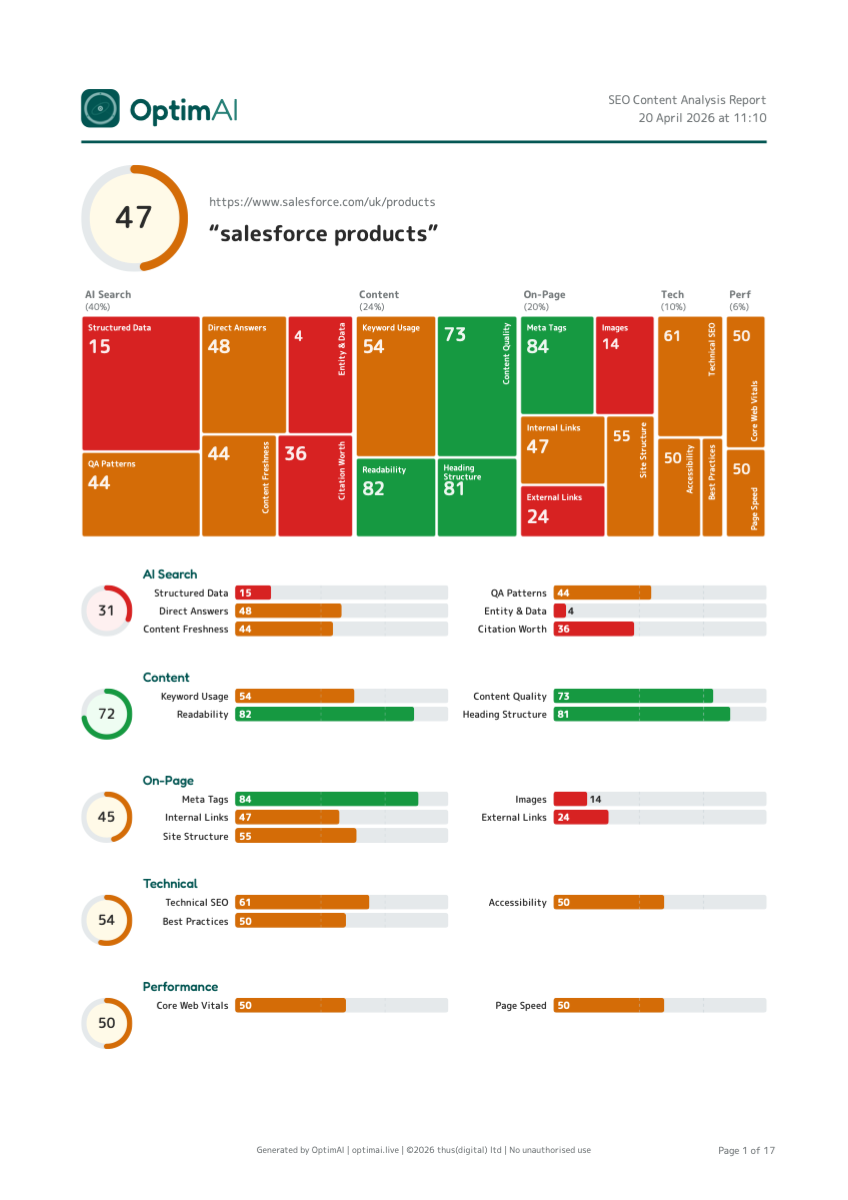
The Salesforce UK products page scoring 61 is a fair real-world example - big brands aren't immune, especially on AI search readiness. Let's walk through a real scan (salesforce.com/uk/products against the keyword "salesforce products", download the full PDF here) and unpack what each number is telling us.
/products/) won't score well for a commercial keyword like "best crm software" - that intent belongs on a dedicated landing page. Before fixing the page, check you're scoring it against a keyword it was actually built to win.
The headline: 61/100 - still dragged down by AI Search
| Category | Score | Weight | Contribution |
|---|---|---|---|
| AI Search Readiness | 49 | 40% | 19.6 |
| Content | 72 | 24% | 17.3 |
| On-Page | 58 | 20% | 11.6 |
| Technical | 92 | 10% | 9.2 |
| Performance | 48 | 6% | 2.9 |
| Overall | 61 | 100% | 61 |
If we excluded AI Search entirely and just scored the traditional SEO dimensions (Content + On-Page + Technical + Performance, 60% of our weighting), this page would land around ~68 - upper amber, a "decent page with rough edges" a couple of fixes away from green. The combined score of 61 isn't an error; it's what happens when you honestly measure a page optimised for 20 years of traditional SEO against the requirements of a search channel that didn't exist three years ago.
AI Search Readiness: 49 - "moderate readiness"
This is the single biggest lever.
| Dimension | Score | Weight |
|---|---|---|
| AI Search Crawlability | 59 | 27% |
| Question-Answer Pattern Quality | 44 | 17% |
| Direct Answer Density | 66 | 17% |
| Citation Worthiness | 36 | 13% |
| Entity & Data Richness | 34 | 13% |
| Content Freshness | 44 | 13% |
Two weak spots stand out: Citation Worthiness at 36 (no external sources, no inline citations - the page asserts but doesn't reference) and Entity & Data Richness at 34 (almost no concrete data points, no pricing, no customer counts). AI systems favour extractable facts and source-anchored claims over marketing prose, and this page leans on marketing prose. The schema markup itself is now decent (Crawlability 59 - organisation and product schema both present), but the content the schema points to isn't built to be quoted.
Salesforce's page clears the schema bar but not the citable-content bar.
Content: 72 - the saving grace
If AI Search is the soft link, Content is why the overall holds up. The page has substantive copy covering multiple product subtopics, clean headings, fair-to-good readability, and clear writing. This is the category where Salesforce's size shows up - they've had editors polishing this copy for years.
On-Page (58), Technical (92), Performance (48) - the mixed-basics story
Technical is excellent - the plumbing under the page (HTTPS, canonical, robots, hreflang, mobile viewport) is dialled in. On-Page and Performance are where the work is:
- Image alt coverage: 23% - of the page's 204 images, only 47 have alt text. 157 images have no alt attribute. That's a 5-minute-per-image fix and a compounding signal for both accessibility and AI extraction.
- Keyword not in H1 - "salesforce products" doesn't appear exactly in the H1. (Caveat: we guessed this keyword from the SERP title; Salesforce's real target could differ.)
- Meta description 147 characters - within Google's ~160-char snippet limit but leaving almost no headroom, so a longer SERP variant will get clipped mid-sentence.
- External links: 47 - excessive for a product hub, dilutes link equity that should be flowing to deeper conversion pages.
Performance at 48 reflects a heavy commercial homepage - the page renders, but Lighthouse pulls it down on bundle size and largest contentful paint. Common for enterprise CMS templates.
AI Search Visibility: cited by 2 of 3 engines
When we ask the AI engines "salesforce products":
| Engine | Status |
|---|---|
| Perplexity | Cited - salesforce.com/products as citation 1 of 5 |
| OpenAI (ChatGPT) | Cited - salesforce.com/ap/products in the response |
| Not found - domain discussed but not cited as a formal source |
Two of three engines cite the Salesforce domain - not always the exact /uk/products page we scanned, but a page from the domain. That's the domain-authority effect: AI engines know Salesforce is an authoritative source and pull in some page from the domain, even if it's not the best-optimised one. Note Perplexity's top slot - that's a real win the page is earning; the structural improvements on AI Search are starting to pay off, they just have further to go.
Why 61 is the right score
Salesforce is the 1,500-pound gorilla of CRM, ranks #2 in Google SERP for "salesforce products", is cited by two of three AI engines, has clean copy and impeccable technical fundamentals. And it scores 61. That's not a flaw in the tool; that's the tool doing its job. Other SEO audit tools would give this page an 80+ and a gold star, because they'd be measuring 20-year-old signals. We're measuring what actually drives discovery in 2026: can AI engines extract, understand, and cite your content? For this page, the honest answer is "partially - the structure is starting to come together, but the content still asserts more than it evidences, and it leans heavily on domain authority for the rest".
The receipts: OptimAI scoring its own landing page
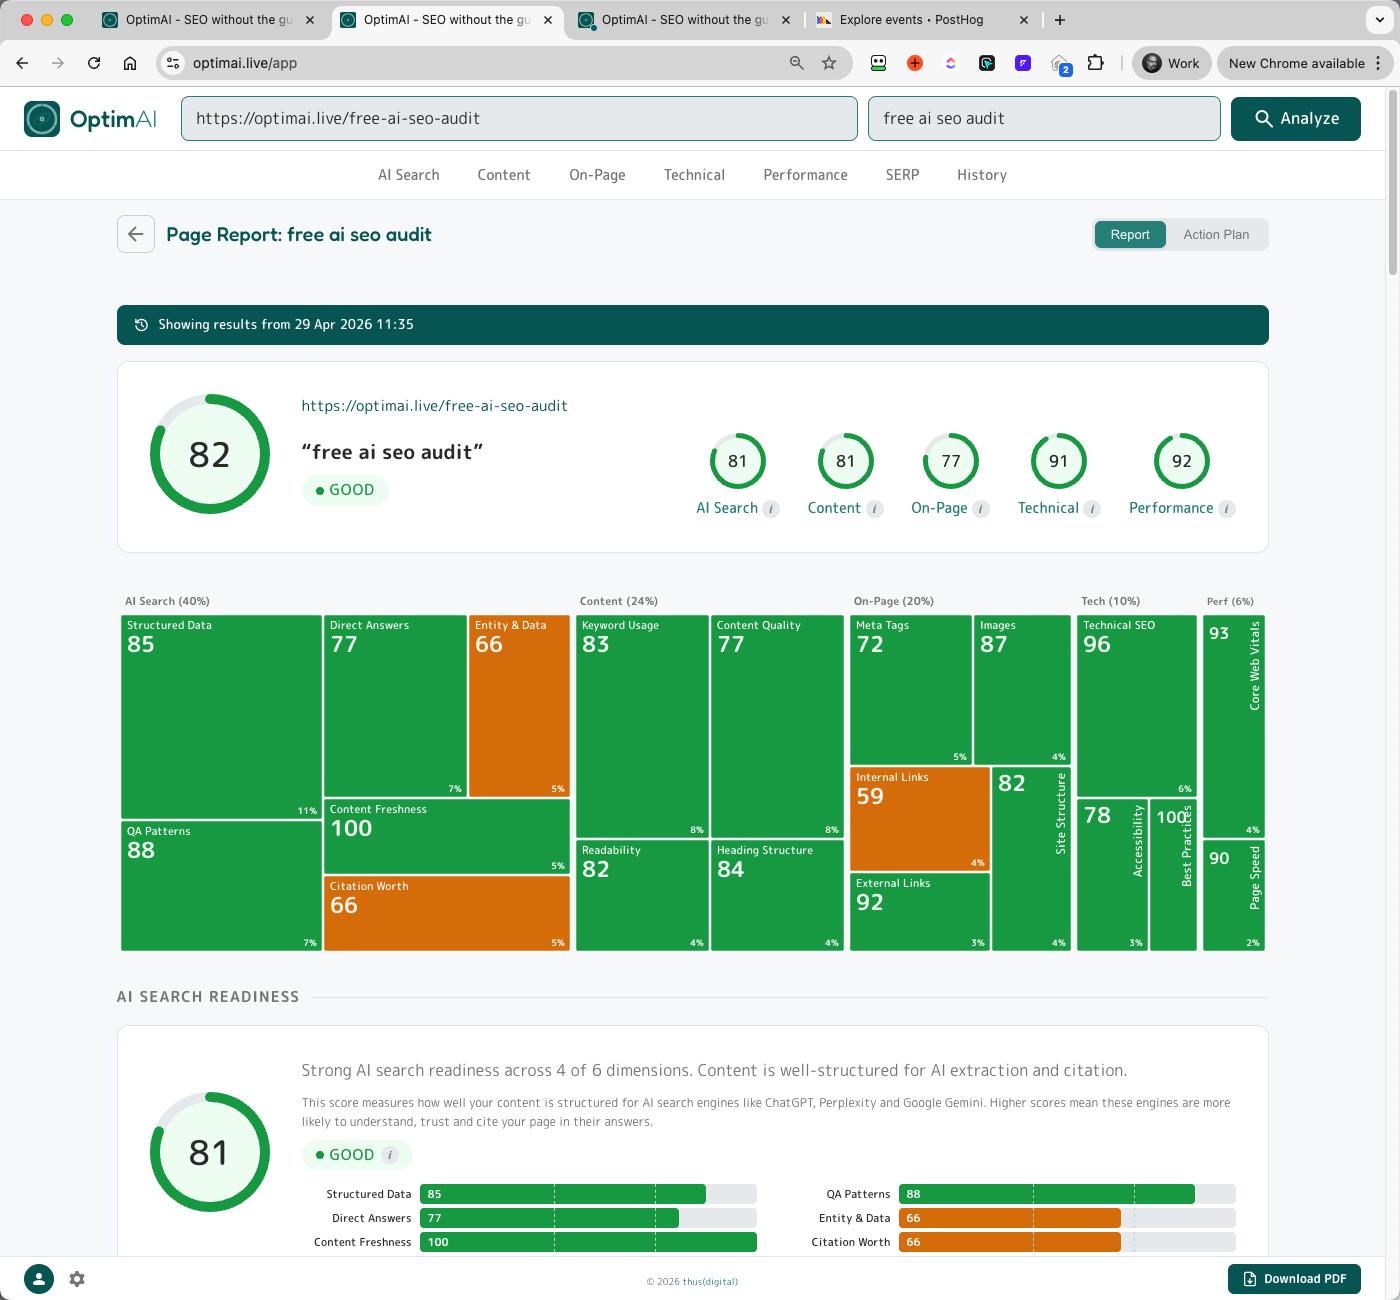
We run the same tool against our own landing page (optimai.live/free-ai-seo-audit, keyword "free ai seo audit") to prove we eat our own dog food:
| Category | OptimAI landing | Salesforce | Delta |
|---|---|---|---|
| Overall | 83 | 61 | +22 |
| AI Search | 83 | 49 | +34 |
| Content | 82 | 72 | +10 |
| On-Page | 81 | 58 | +23 |
| Technical | 91 | 92 | -1 |
| Performance | 80 | 48 | +32 |
Salesforce edges us by a single point on Technical - fair enough, their enterprise plumbing is world-class. Everywhere else the gap is structural, not resource-based: explicit entity naming, short citable paragraphs, concrete data points, and external sources baked into the copy. The Salesforce page wins on raw inputs (domain authority, word count, budget) but loses on the structural choices that decide whether AI engines can actually quote you. Every suggestion the tool gives other pages, we've already taken on our own.
P.S. This scan was run pre-launch, before the site was indexed - so you'll see zero AI citations and no ranked keywords on our own report. That's expected for a brand-new domain. The point of the comparison is the structural score (how well the page is built for AI search and on-page fundamentals), not the visibility score - visibility will build naturally as the site gets indexed and linked.
2. Getting Around
A quick tour of the UI surfaces. This is shallow on purpose - the meat is in Section 3.
2.1 Dashboard
After your first scan, the dashboard becomes your home view. From any report, click the OptimAI logo (top-left) or the app back button (next to the Page Report heading) to return to the dashboard at any time.
- Your Pages table - every scan you've ever run (we keep lifetime history). Columns: # / Page / Keyword / Score / Change / Scans / Last Scan / Refresh. Click any row to open the report.
- Filter input (top-right of table) - filters by URL or keyword, client-side, instant.
- Refresh button - re-scans the same URL+keyword at the reduced refresh cost.
- Region banner (top, dismissible) - tells you which country we're scoring against. Change from the settings menu.
2.2 Settings menu
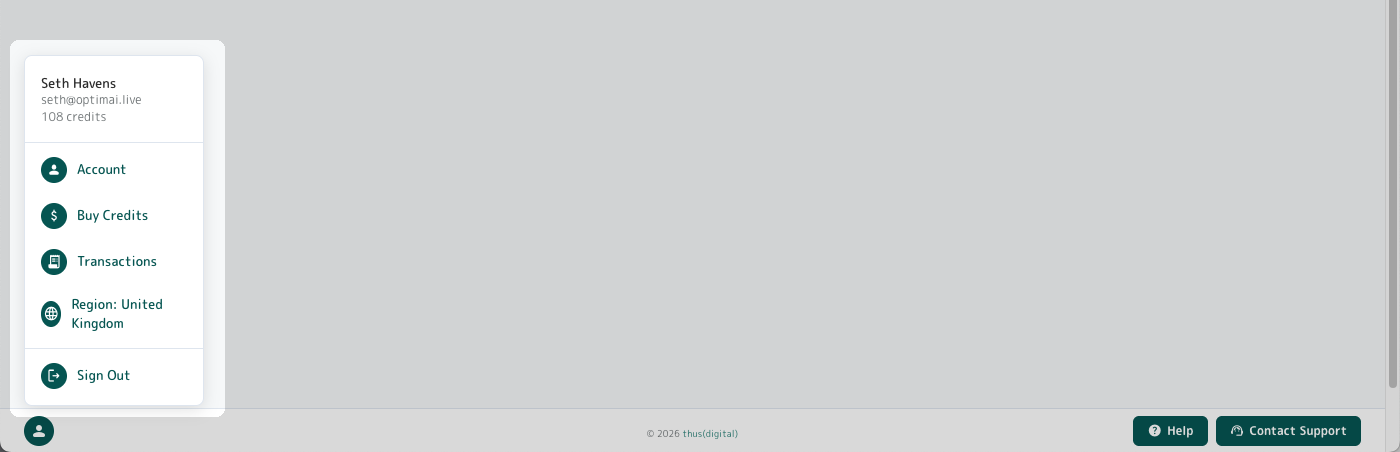
Open from the avatar bottom-left of any page. Header shows your name, email, current credit balance. Menu items: Account (opens the Account modal), Buy Credits, Transactions, Region, Sign Out.
2.3 Account modal
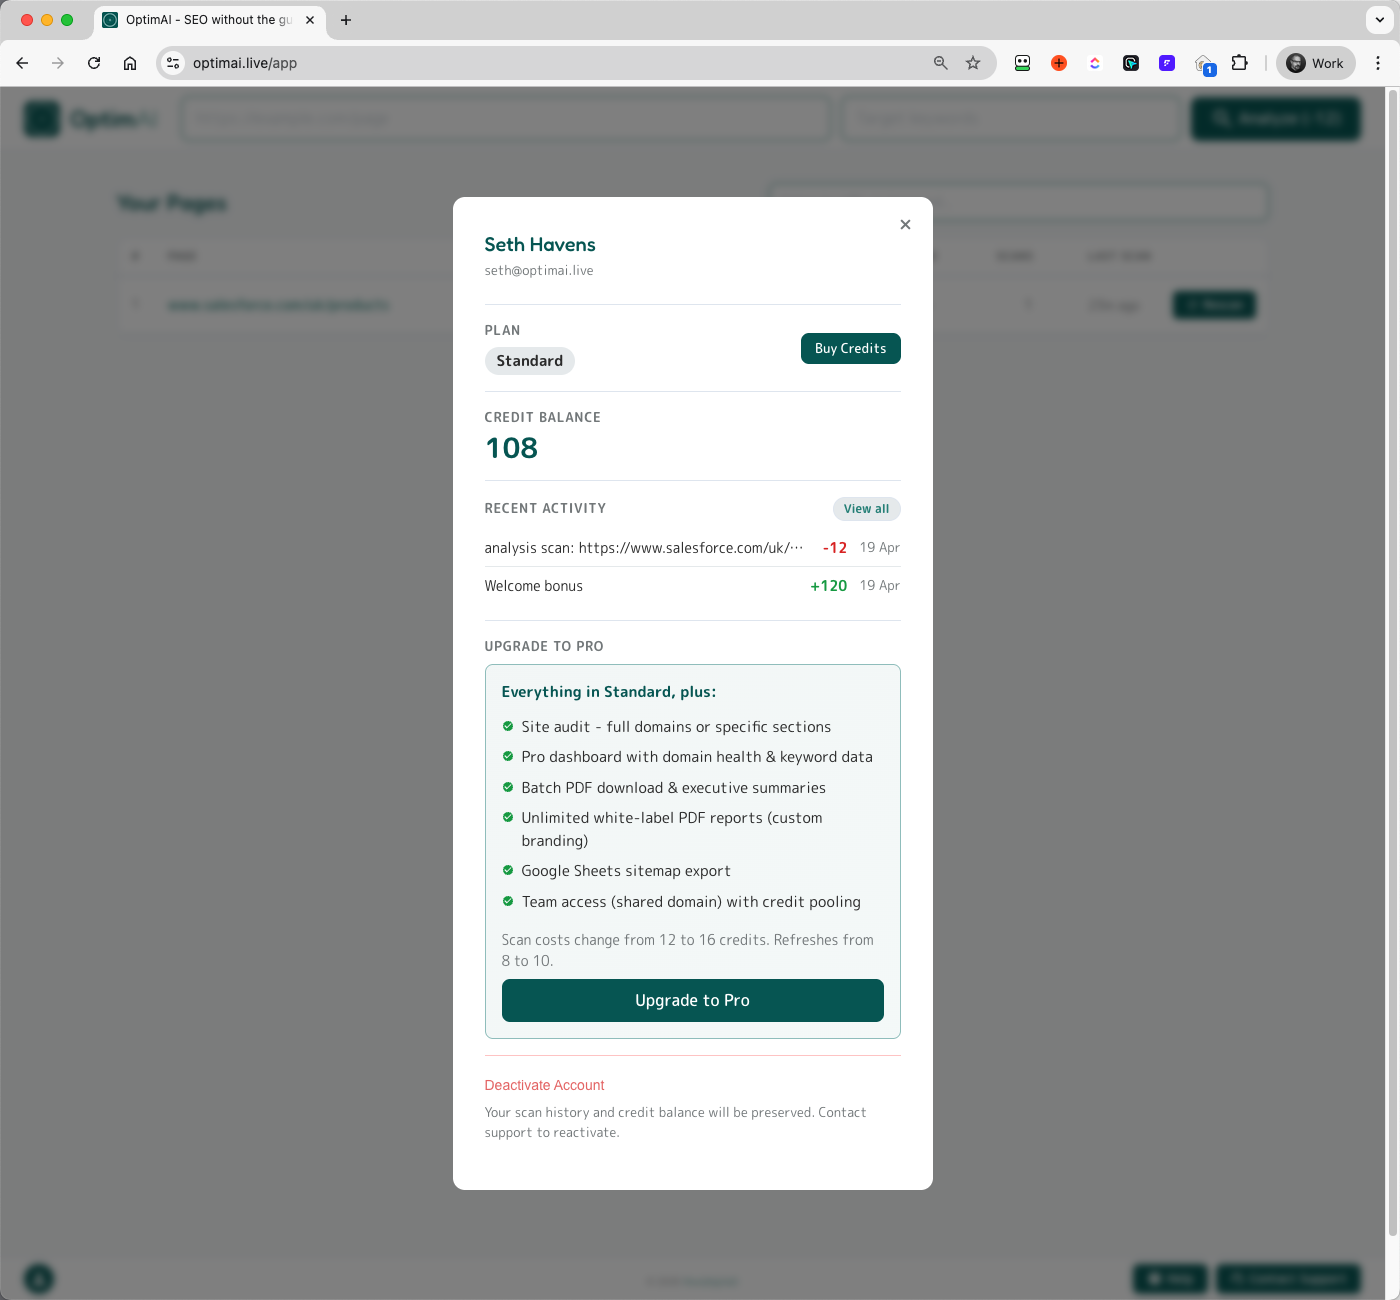
Your full account profile: identity, tier, credit balance, recent activity, upgrade path to Pro, and a Deactivate Account option (your scan history and credit balance are preserved - contact support to reactivate).
2.4 Buy credits
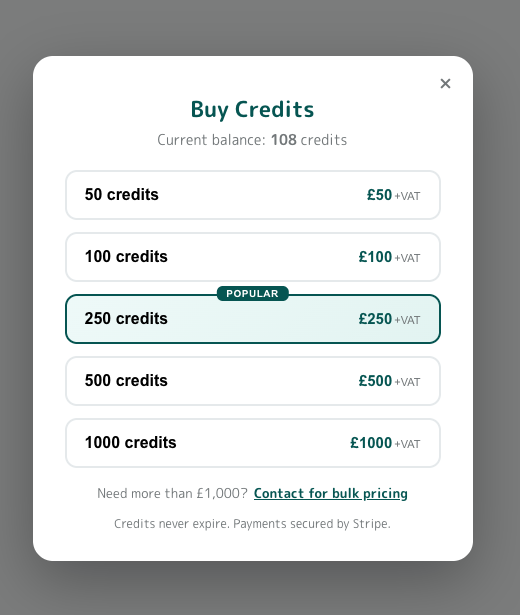
Five credit packs available in GBP and USD. VAT exclusive on GBP transactions (UK 20%), rest of world exempt. Credits never expire. Need more than £1,000? There's a bulk pricing contact link.
2.5 Transactions
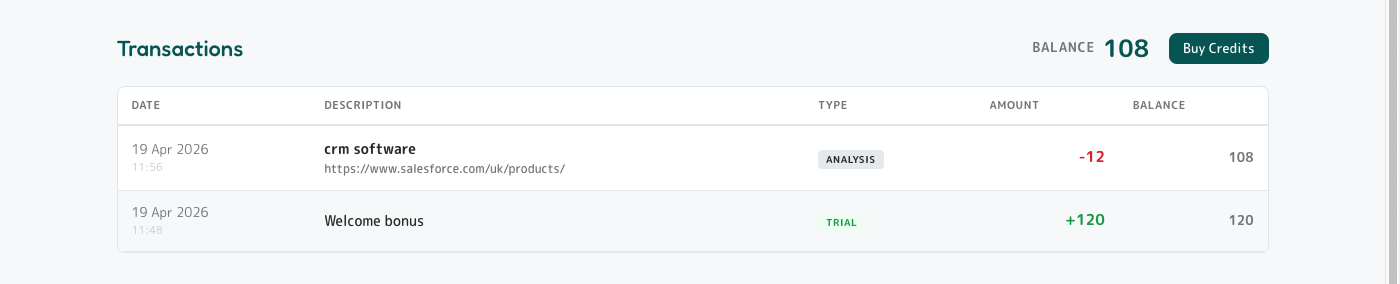
Full ledger of every credit movement on your account. Every scan debit, every purchase, every bonus, every refund - dated, categorised, with running balance. Reachable from settings menu or the Account modal's Recent Activity link.
2.6 Region picker
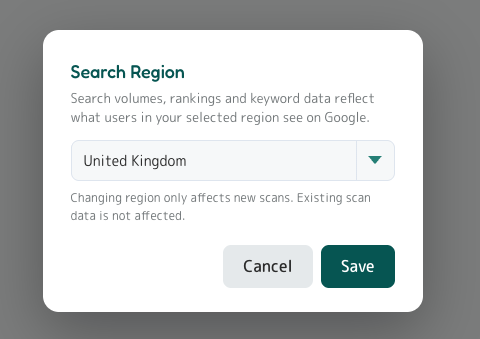
Region matters. If you're optimising for a UK audience but your account is set to United States, search volumes, keyword rankings and competitor data will all reflect US Google rather than the Google your customers actually use. We auto-detect region from your IP, but you can override it any time from the region picker in the settings menu.
Changing the region only affects new scans. Existing scans stay tied to the region they were scanned under - if you want to re-region a historical report, run a fresh scan after switching.
2.7 Same page, different keywords
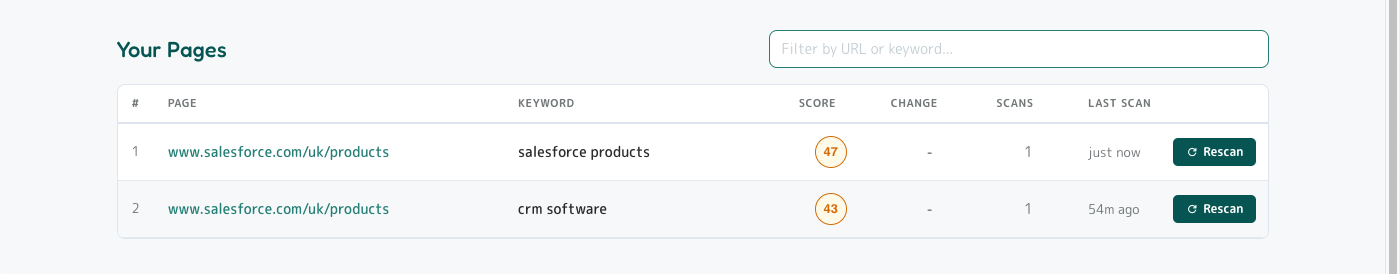
Each URL+keyword pair is treated as a separate scan and gets its own dashboard row. Scanning the same page against multiple keywords is a legitimate and useful pattern - different keywords surface different strengths and weaknesses.
3. Report Deep Dive
The single-page report is one long scrollable view broken into sections. Every score on the page comes from the same scan - the dashboard, the report, the PDF and the action plan are all reading the same numbers.
3.1 Three navigation surfaces
The report gives you three navigation surfaces, each tuned for a different reading style:
Section Nav Bar
Buttons for every section (AI Search, Content, On-Page, Technical, Performance, plus Keywords, SERP and History when data exists). Active section highlights as you scroll.
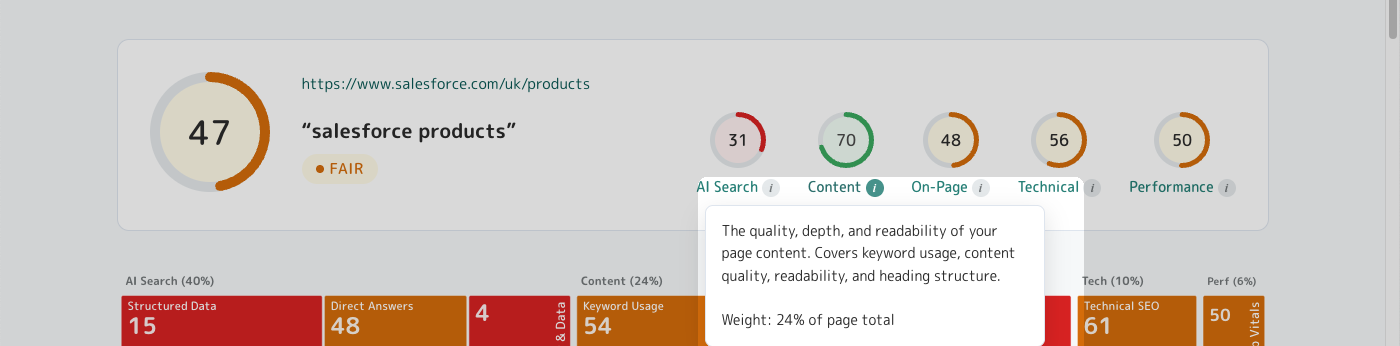
Top panel score gauges
Five clickable category score circles in the top panel (AI Search / Content / On-Page / Technical / Performance). Each is a smooth-scroll link to that category's section. Also serves as a compact weight indicator - click the info icon to see what % of total each category contributes.
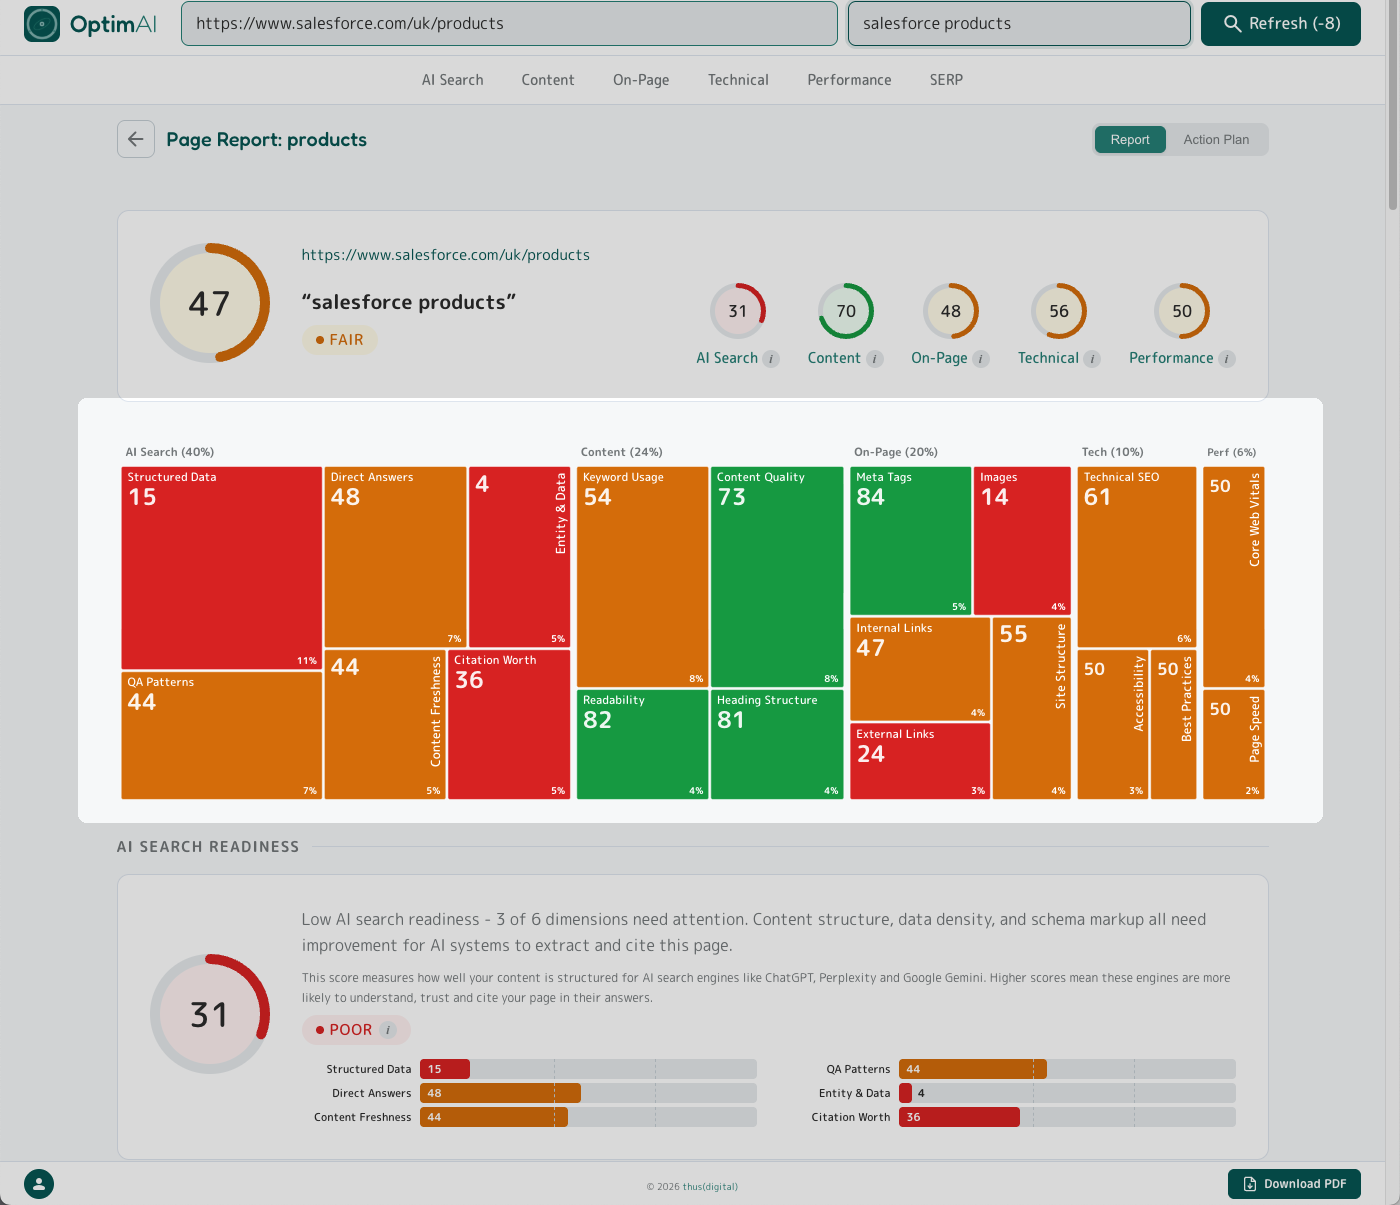
Dimension Heatmap
Every dimension shown as a coloured tile, sized by its weight in the total score and coloured by its rating (red / amber / green). Click any tile to jump to that dimension's panel. The at-a-glance "where's the damage" view - the biggest red rectangle is your biggest problem.
3.2 AI Search Readiness (40% of total)
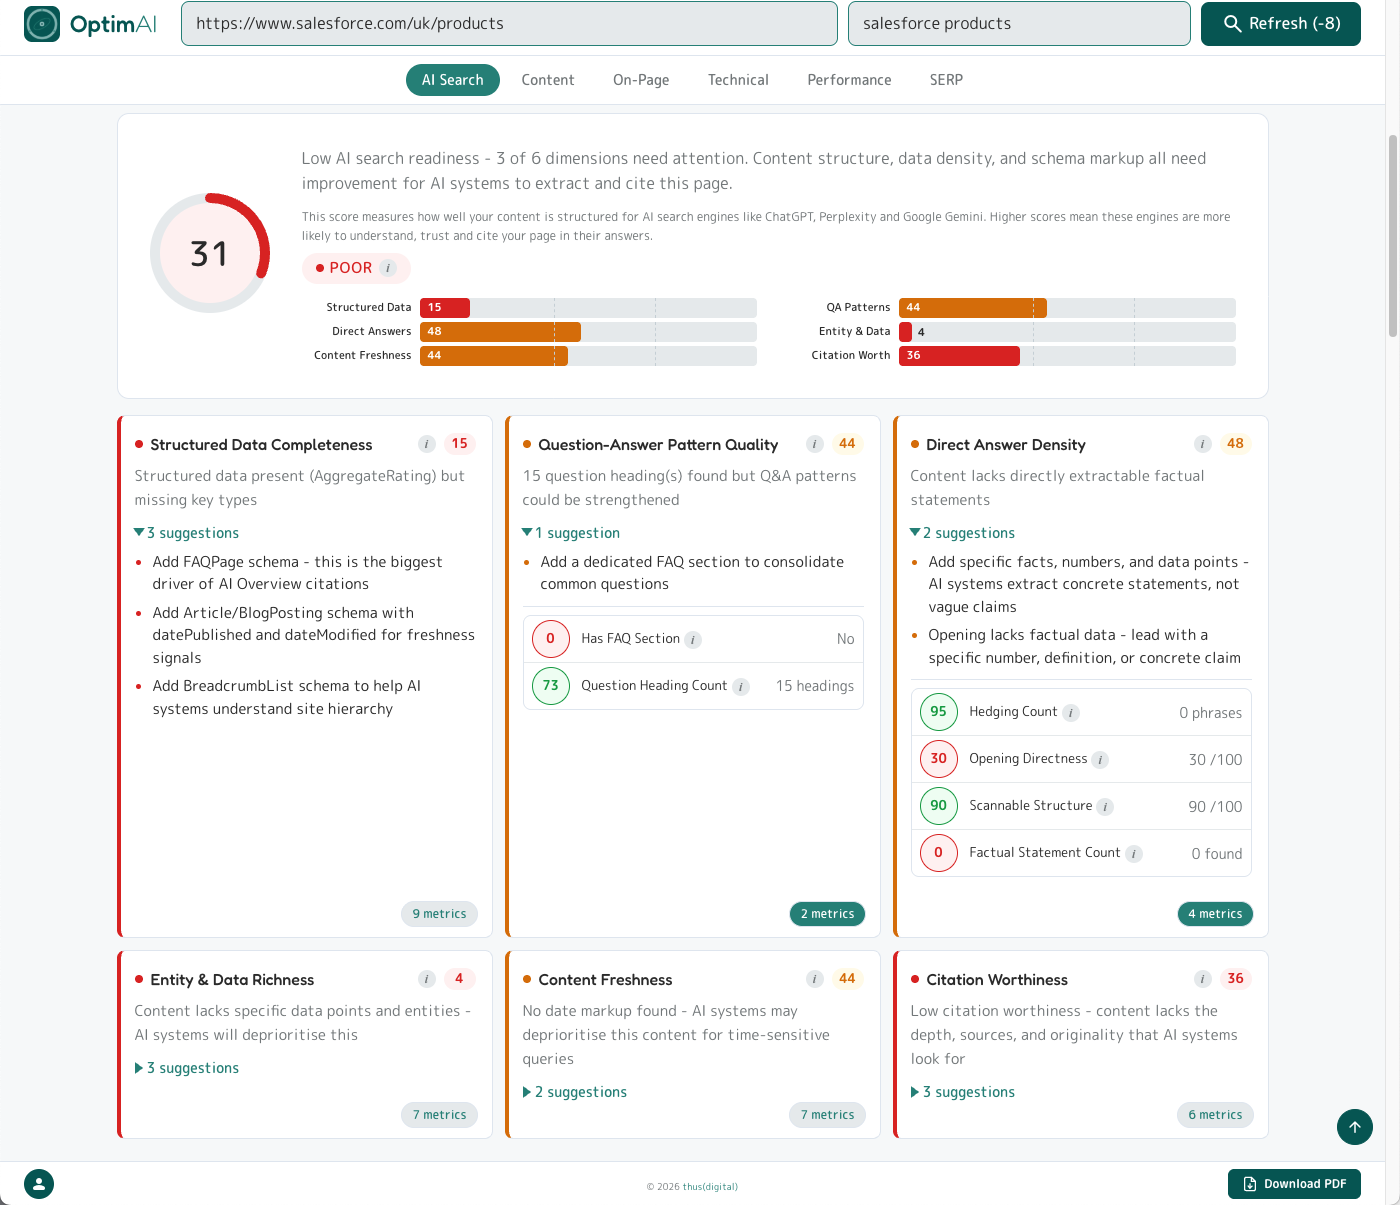
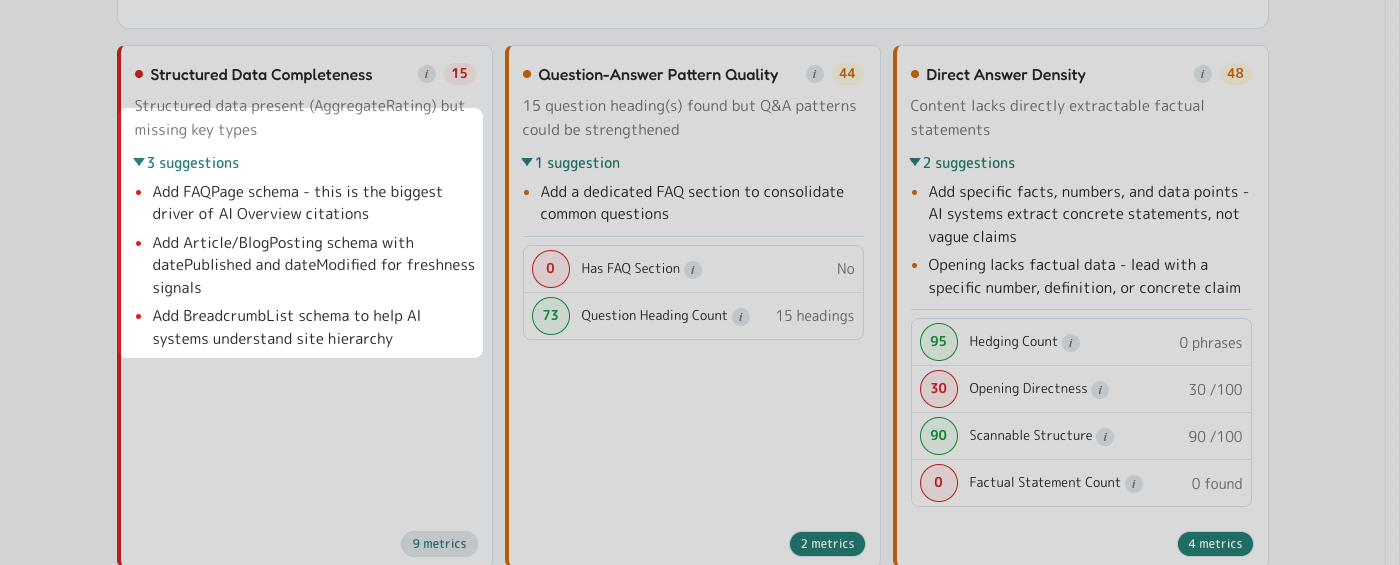
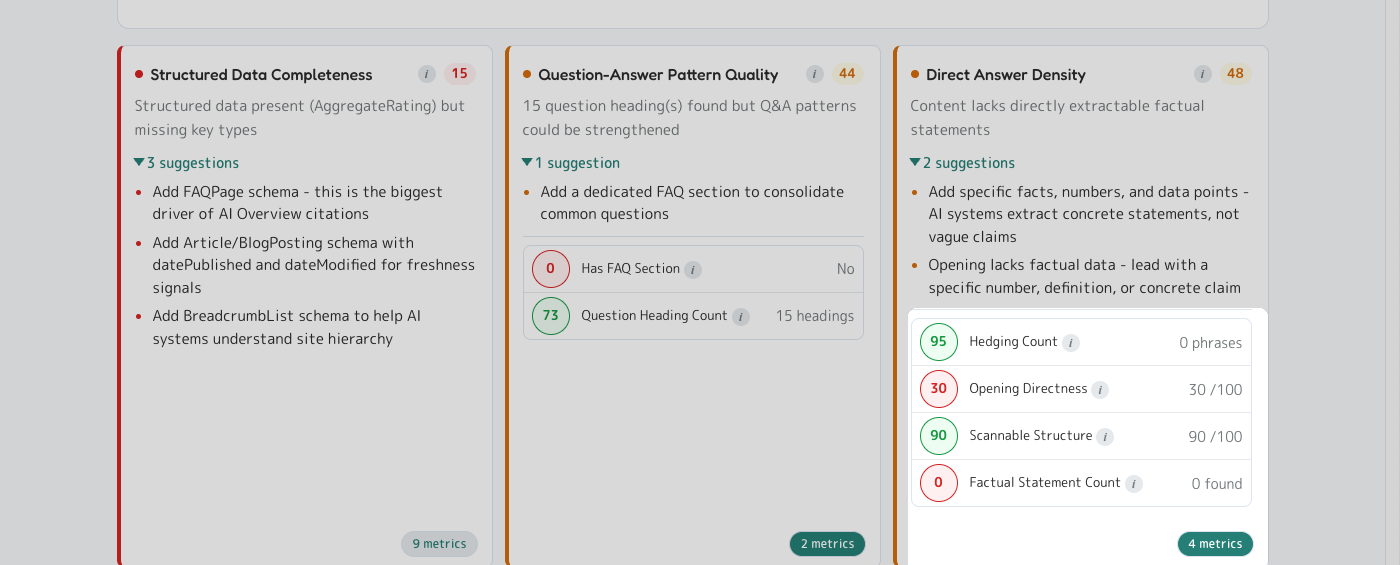
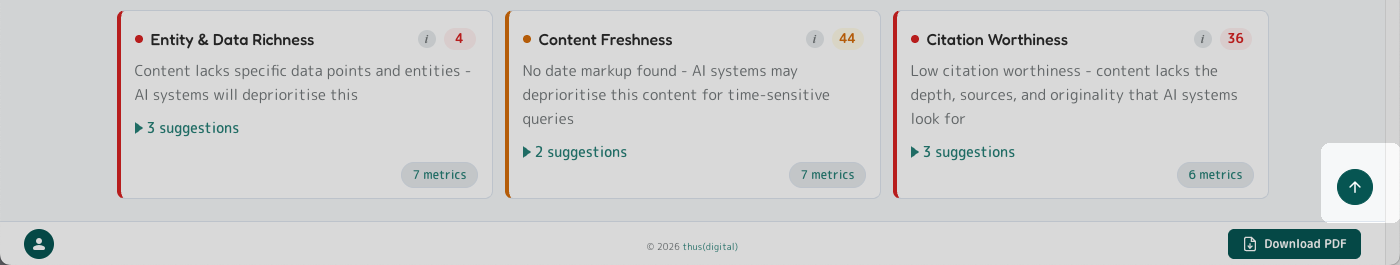
The biggest category by weight, and the part most legacy SEO tools don't measure at all. The AI Search top panel shows the category score, a plain-English diagnosis, an explainer, and a horizontal bar chart of the 6 dimensions ranked. Below the top panel, each dimension gets its own panel with score, verdict line, up to 3 top priority suggestions, and an expandable "N metrics" pill that reveals every measured signal.
3.2.1 AI Search Crawlability (27% of AI Search Readiness)
Two layers combined: (a) crawler access - whether AI search engines can reach this page at all (robots.txt allowlist for OAI-SearchBot, PerplexityBot, ClaudeBot, GPTBot, Google-Extended; llms.txt presence; JavaScript-render dependency) - and (b) schema hygiene - JSON-LD presence and schema-type completeness (FAQPage, Article/BlogPosting, BreadcrumbList, Organization, LocalBusiness, Product, HowTo).
3.2.2 Question-Answer Pattern Quality (17% of AI Search Readiness)
Counts question-style headings ("What is...", "How does...", "Why..."), looks for a dedicated FAQ section, and checks for FAQPage schema. AI engines extract Q&A pairs and cite them as direct answers. Aim for 3+ question headings; 5+ for full long-tail coverage.
3.2.3 Direct Answer Density (17% of AI Search Readiness)
Measures how extractable your content is. Counts factual statements (numbers, percentages, currency, measurements, specs), hedging phrases ("we believe", "possibly"), opening directness, and scannable structure. AI models prefer concrete, quotable claims and skip vague marketing copy.
3.2.4 Citation Worthiness (13% of AI Search Readiness)
Whether your page contains the depth, sources, and originality that AI engines weigh when picking which sources to cite. Looks for original data/research, external references, author attribution, and content depth.
3.2.5 Entity & Data Richness (13% of AI Search Readiness)
How dense your page is with named entities (companies, people, products, places) and specific data points. AI systems build knowledge graphs - pages rich in related entities are cited more often as authoritative sources.
3.2.6 Content Freshness (13% of AI Search Readiness)
Whether your page exposes published/modified dates, references the current year, and shows recent temporal signals. AI engines deprioritise stale content for time-sensitive queries.
datePublished and dateModified in your Article schema. Display the "last updated" date visibly on the page.
3.3 AI Search Visibility
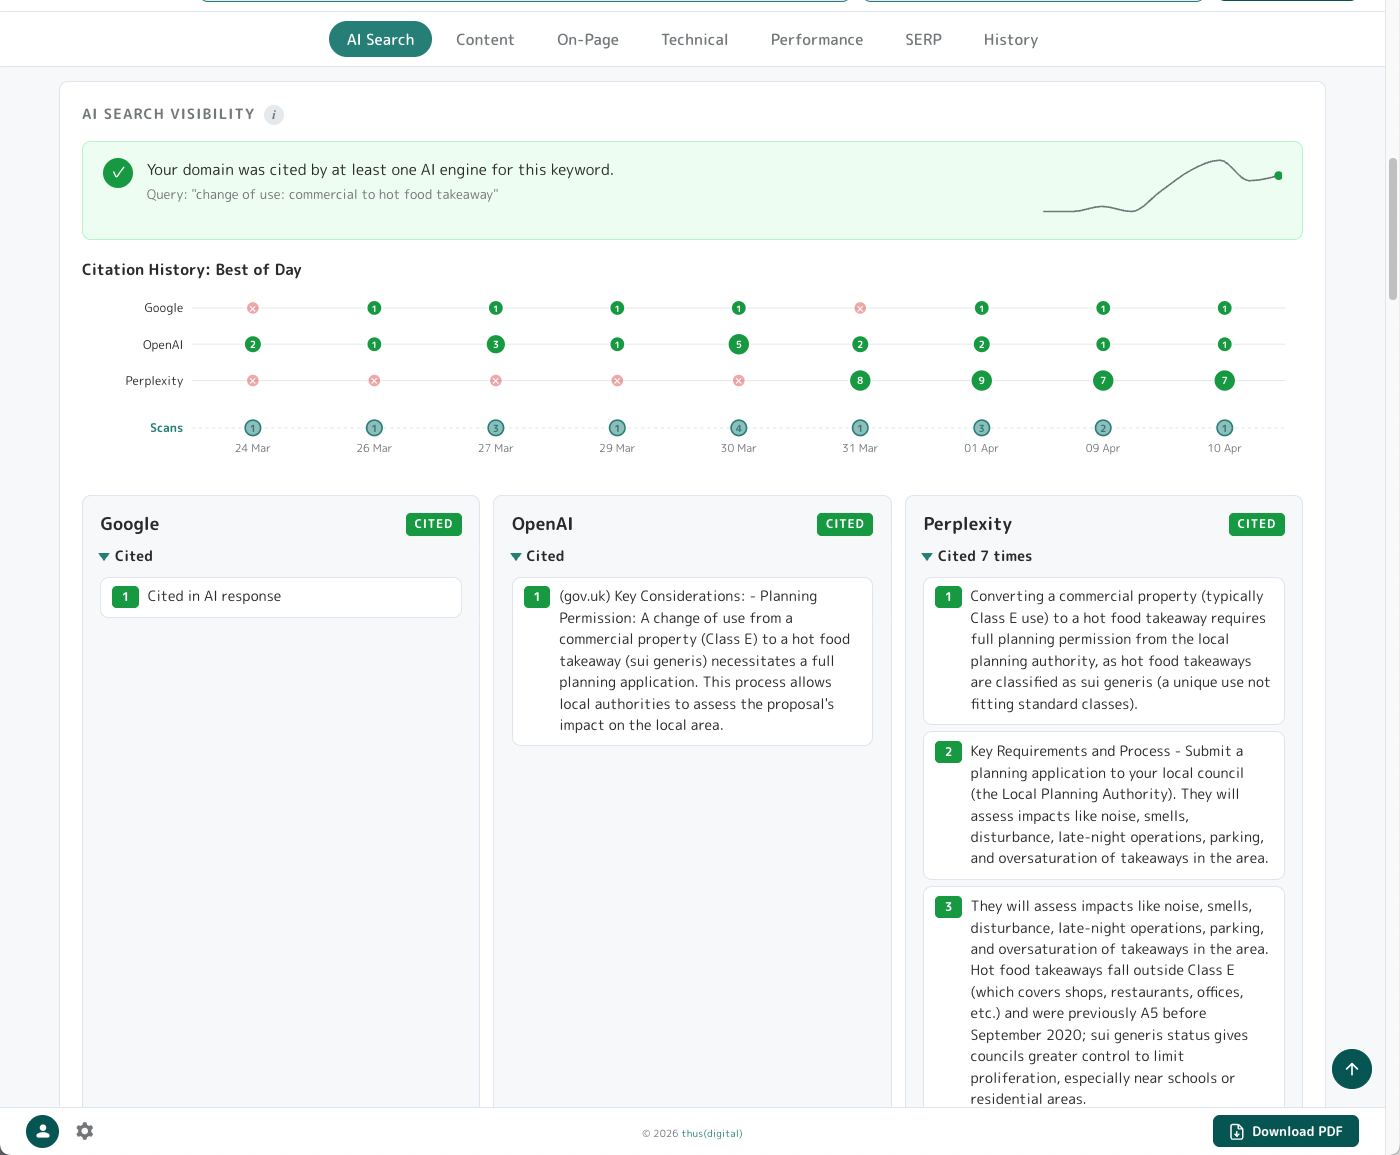
Below the 6 dimension panels, the AI Search Visibility panel tells you whether AI engines are actually citing your domain right now for the keyword you scanned.
Layout: status banner (green tick or red X), citation timeline sparkline, three engine panels (Google / OpenAI / Perplexity), and a Competitor Analysis table comparing your page vs the average of the top cited pages.
Each engine panel shows a badge: Cited (green), Mentioned (amber - in text but not formally cited), Not Found (red), or Unavailable (engine API errored). Cited engines expand to show the actual citation snippets where available.
Caveat on Google: the way we query Google differs from how we query Perplexity and OpenAI - which means for Google we can confirm whether your domain was cited but not always show the exact snippet that referenced you. For Perplexity and OpenAI you get the full context around your cited reference.
AI search results are non-deterministic. Re-running a scan can produce different results because the engines themselves don't always cite the same sources. Patterns matter more than single data points - which is why the timeline bubble chart exists.
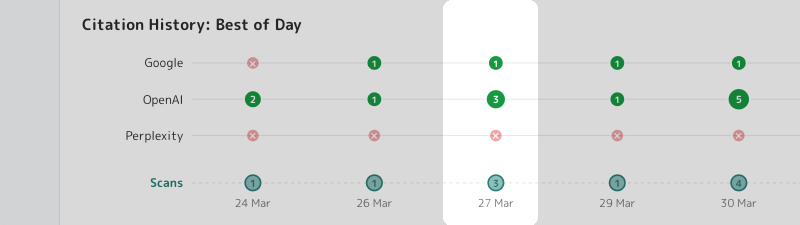
You'll only see the bubble chart timeline after you have run more than one scan. It's possible to run more than one scan in a day, each of which may get entirely different citation results. The bottom row of the bubble chart shows how many scans were run on a given date - in the screenshot above you can see the highlighted column shows 3 scans run on 27th March. We show the highest count of citations from the scans run that day - here you can see one scan got 3 citations from OpenAI and 1 from Google, which could have come from different scans that day.
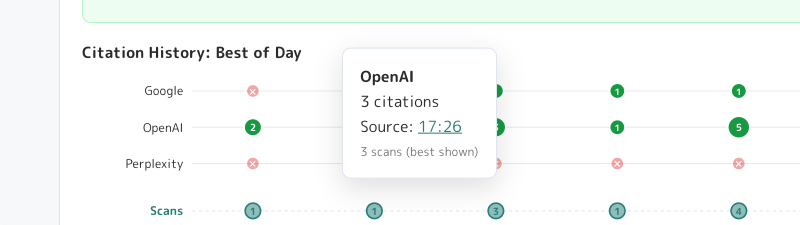
If you click one of the green bubbles you'll get a tooltip telling you which scan from that day got you the citations - click the timestamp link where it says "Source" to view that report in full, so you can check the exact details.
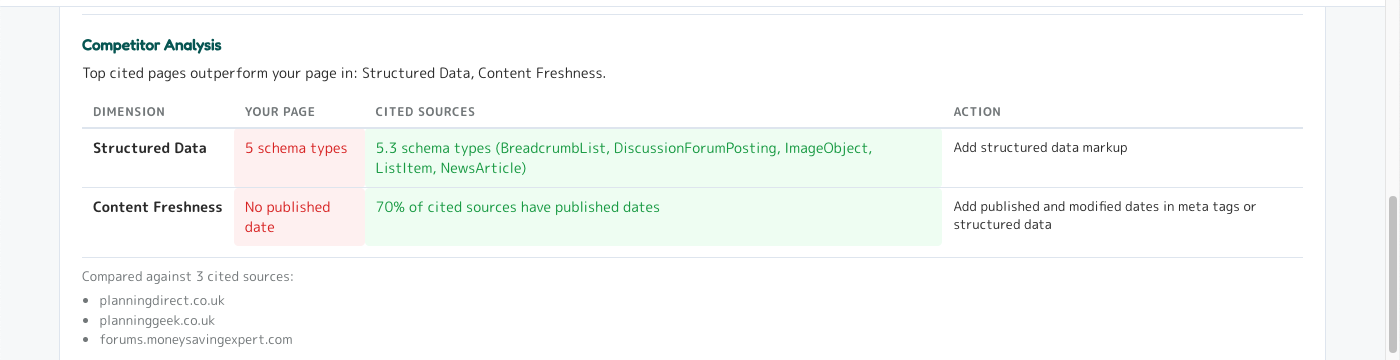
When possible (this depends on whether AI engines return any citations at all, which isn't guaranteed) we also analyse the other sites that were cited against the same AI Search Readiness metrics as your page. We distill this down into a comparison of which AI Search Readiness dimensions other cited sites are achieving higher scores in than you - giving you a real-time AI Search competitor analysis.
3.4 AI Search Opportunity
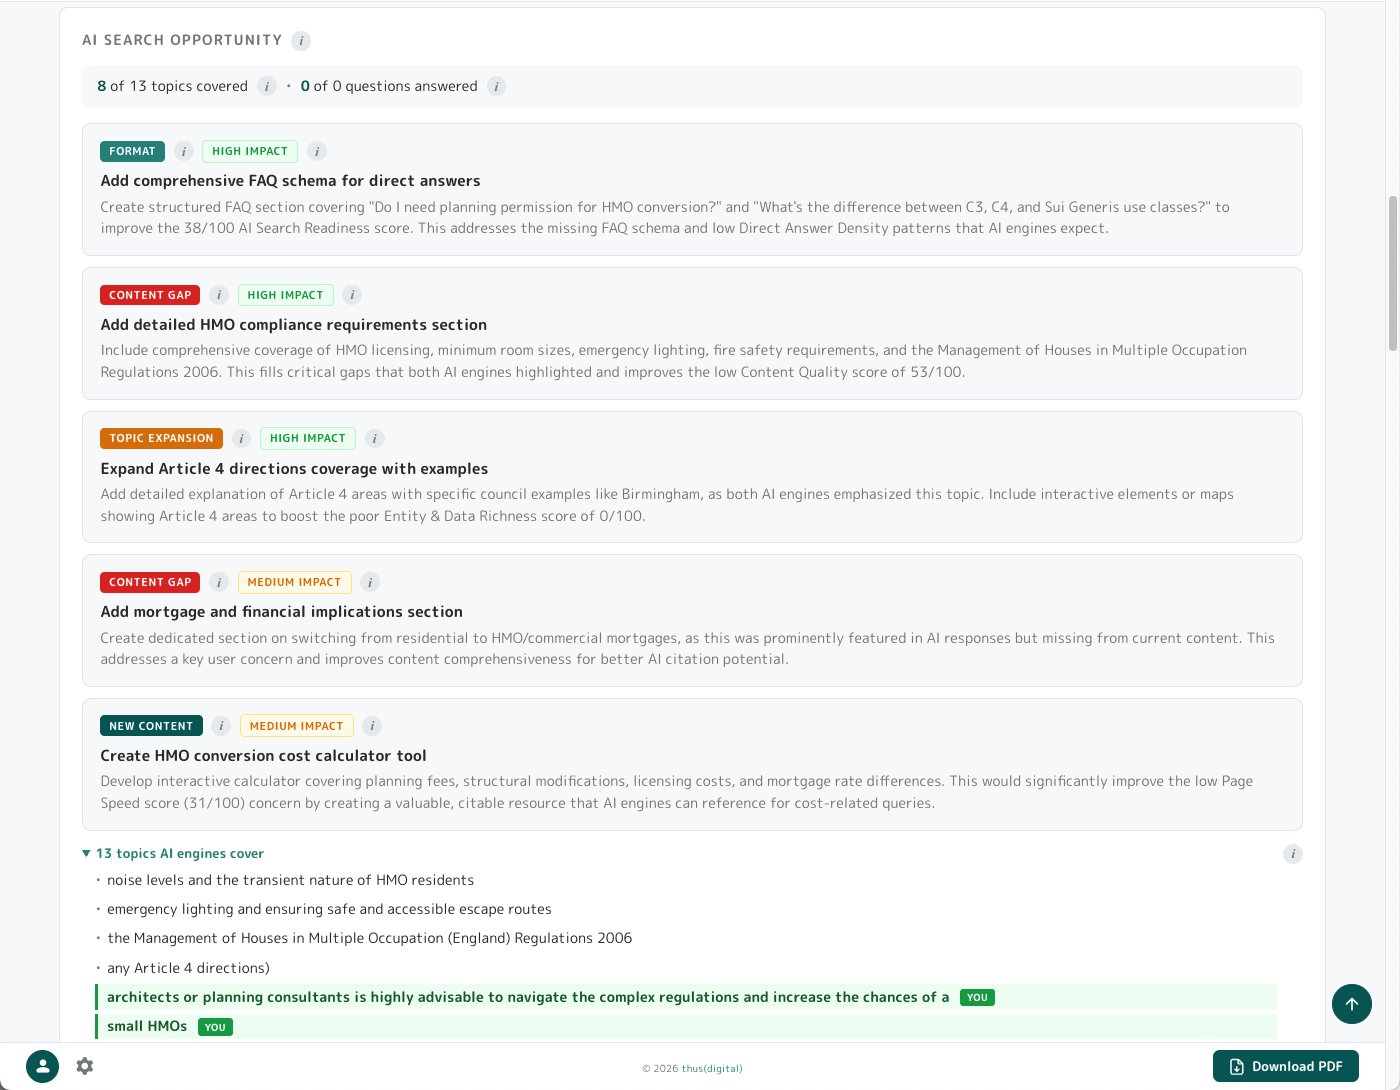
The companion to AI Search Visibility. While AI Search Visibility tells you whether AI engines are citing your domain, AI Search Opportunity reverse-engineers what AI engines are actually answering for your keyword and flags what's missing from your page.
How it works: when you scan, we query Perplexity, OpenAI and Google for your keyword and analyse their responses. We extract the questions AI engines are answering, the topics they cover, and the domains they cite. Then we compare against your page content and flag the gaps.
The panel shows:
- Coverage stats: "X of Y topics covered", "X of Y questions answered" - your gap at a glance
- Suggestion panels in four types, each colour-coded:
- Content Gap (red) - subjects cited sources cover that you don't. Add this content to compete.
- Topic Expansion (amber) - topics you mention but don't cover deeply.
- Format Change (teal) - structural changes (FAQ schema, lists, tables) cited sources use.
- New Content (dark teal) - standalone pages worth creating to capture adjacent queries.
- Expandable lists of all questions and topics - items already on your page show a "you" badge
- Cited domains - the actual sites AI engines are pulling from
Tip - the full AI search picture: AI search is already eating the clicks traditional SEO used to capture, and the tools most agencies still run were built for a pre-AI world.
Sections 3.2 AI Search Readiness, 3.3 AI Search Visibility and 3.4 AI Search Opportunity together give you what those tools don't:
- Readiness - what your page looks like to an AI engine
- Visibility - whether you're actually being cited right now
- Opportunity - what you'd need to cover to compete
Topic Expansion specifically maps to the way AI engines "fan out" a user's query into related sub-questions before retrieval - the more of that fan your page meaningfully covers, the stronger a citation candidate you become across the whole conversation, not just the single keyword.
Most other AI-search tools we've seen stop at brand-mention tracking - telling you you're losing without telling you how to win. Combining a structural readiness score, a live citation check and a gap-against-cited-peers analysis in one scan is pretty powerful stuff - and it's how you stay ahead as AI answers reshape organic search, rather than watching the traffic drop and wondering why.
3.5 Content (24% of total)
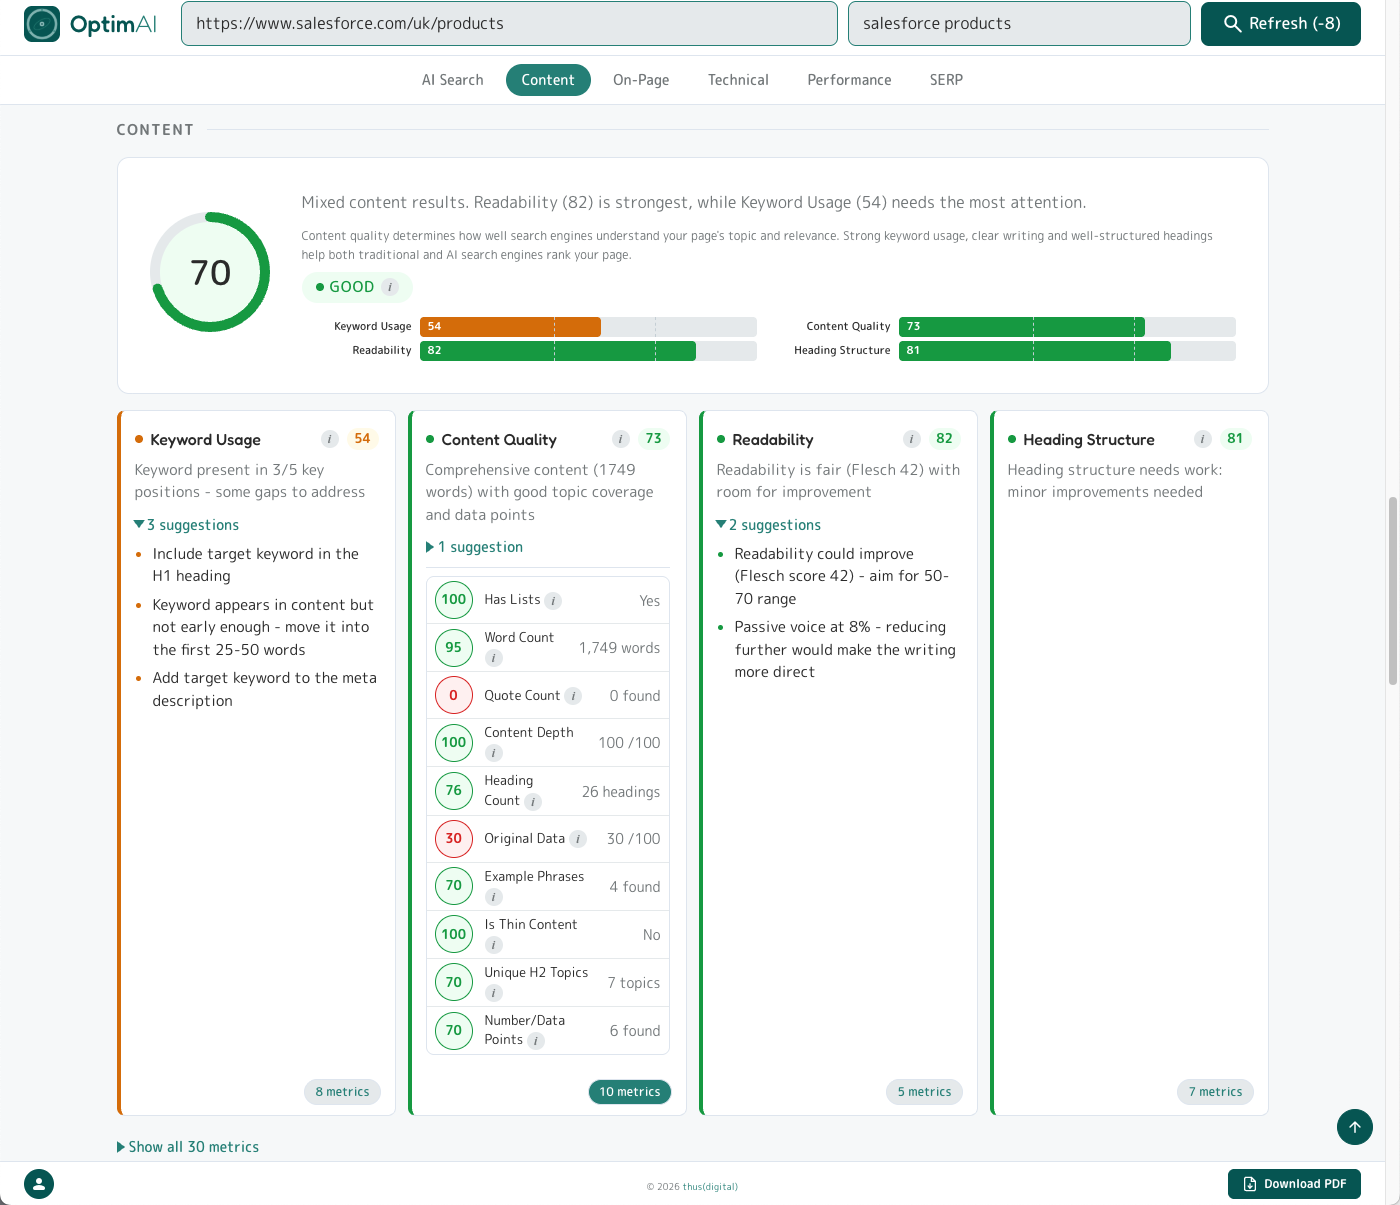
Category top panel opens with a plain-English diagnosis, an explainer, the category weight tag, and a horizontal bar chart of the 4 dimensions.
3.5.1 Keyword Usage (32% of Content)
Where your target keyword appears: H1, title tag, meta description, URL, first 100 words, body copy. Also measures keyword density (target 0.5-2.5%) and semantic variants.
3.5.2 Content Quality (32% of Content)
Word count, topic depth (distinct H2 subtopics), and presence of supporting elements (lists, examples, data points). Thin content (<500 words) gets dinged; 1000+ words covering the topic from multiple angles scores well.
3.5.3 Heading Structure (18% of Content)
H1 presence and uniqueness, keyword in H1, hierarchy (H1 > H2 > H3 with no skipped levels), total heading count, descriptive vs vague heading copy.
3.5.4 Readability (18% of Content)
Flesch reading ease score (target 60+ for general audiences, 50+ for B2B), sentence length, syllables per word, paragraph length. Hard-to-read content loses both human readers and AI extraction quality.
3.6 On-Page (20% of total)
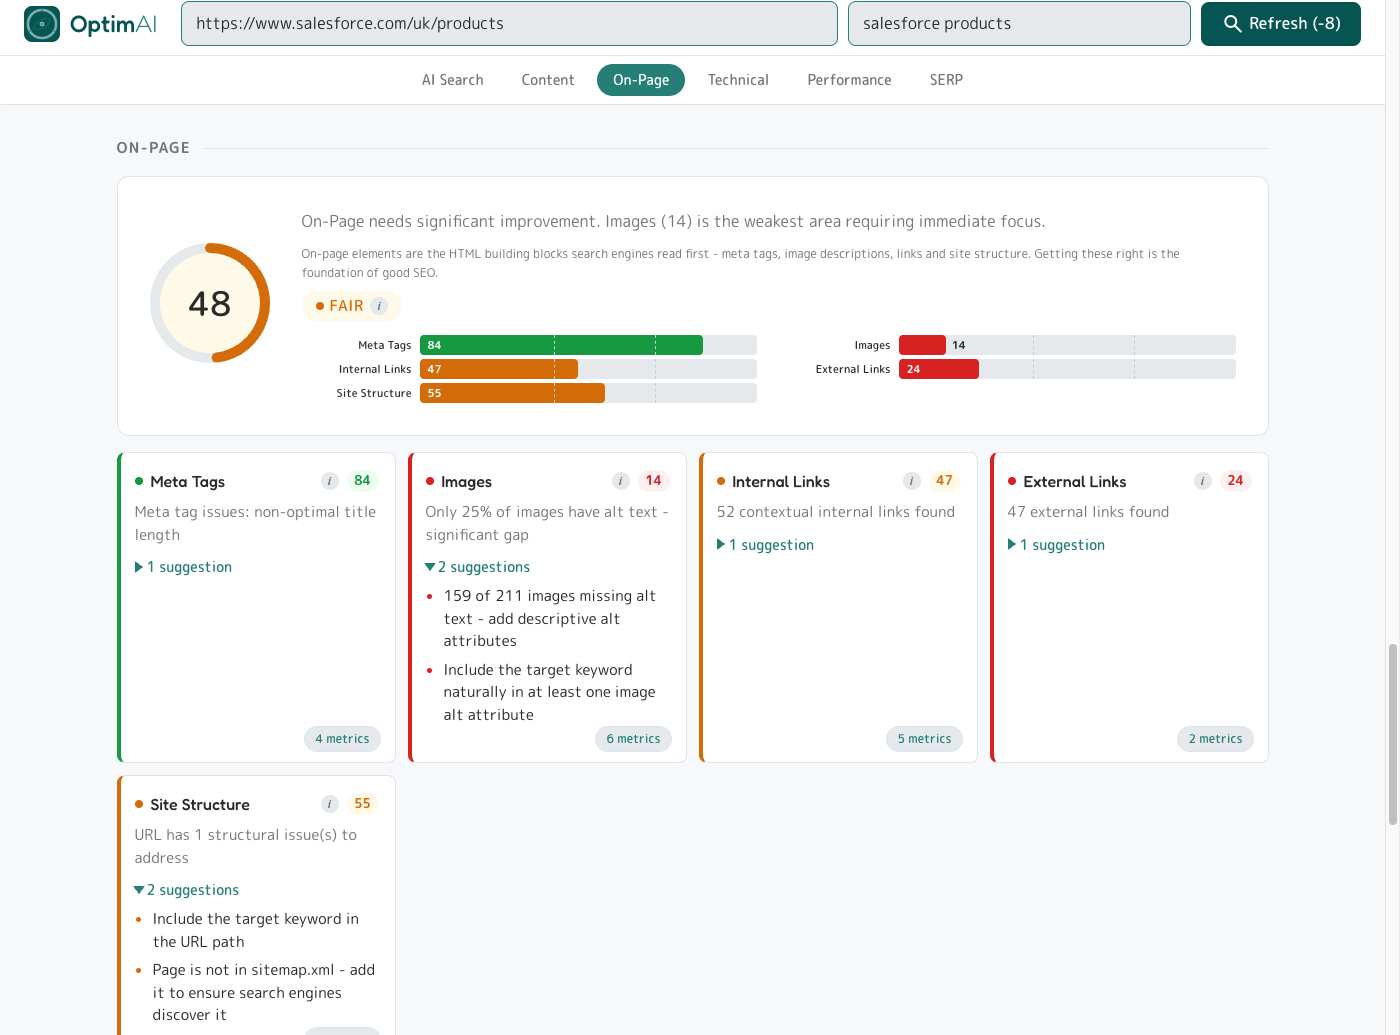
The HTML mechanics search engines and AI crawlers read first. Less glamorous than AI Search but cheap to fix and essential to get right.
3.6.1 Meta Tags (25% of On-Page)
Title tag length (50-60 chars optimal), meta description length (150-160 chars), keyword presence in both, OpenGraph and Twitter card tags for social previews.
3.6.2 Images (20% of On-Page)
Alt text coverage (target 100%), keyword in alt text where relevant, image dimensions/sizing, lazy loading, modern formats (WebP/AVIF).
3.6.3 Internal Links (20% of On-Page)
Number of internal links (10-30 typical), descriptive anchor text, keyword in anchor text where relevant, links to related pages on your site.
3.6.4 Site Structure (20% of On-Page)
URL cleanliness (lowercase, hyphens not underscores, no parameters, keyword in path), URL depth (2-3 levels typical), HTTPS, canonical tag presence.
3.6.5 External Links (15% of On-Page)
Number of external links, nofollow vs follow, links to authoritative sources, broken external links.
3.7 Technical (10% of total)
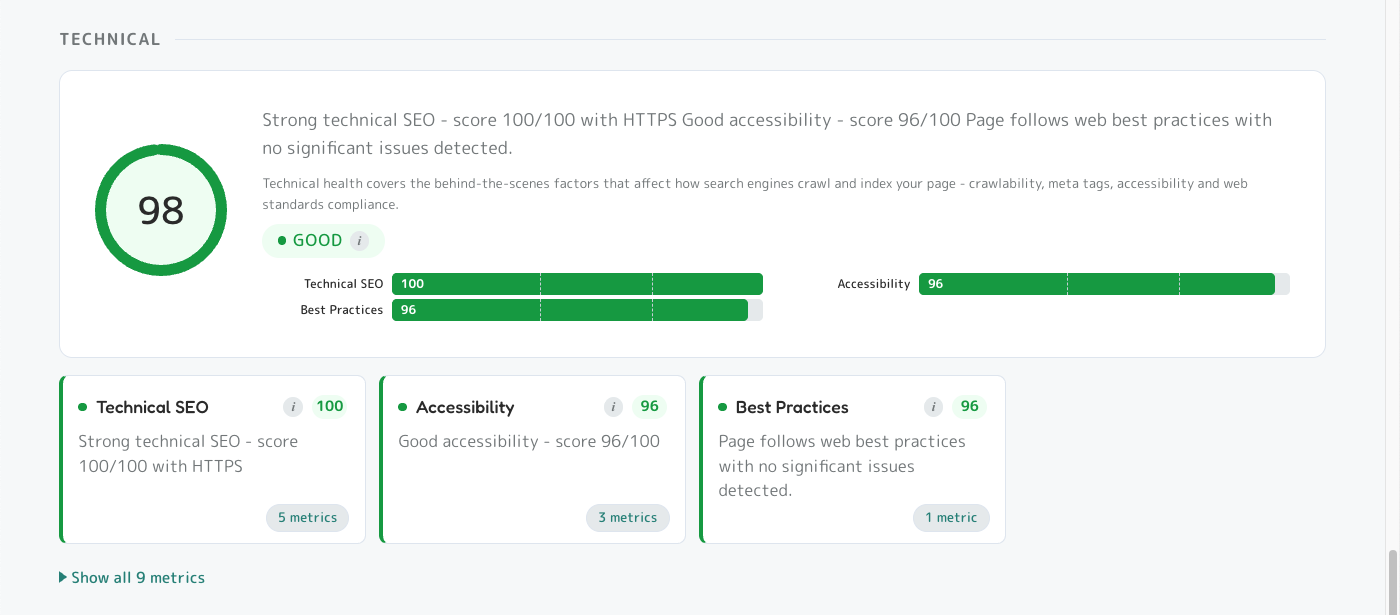
The behind-the-scenes plumbing search engines and AI crawlers check first. If we can't measure a dimension during the scan - usually because the page requires login, hides content behind JavaScript, or the server times out - we assign a neutral score of 50 (the exact midpoint) so it doesn't pull your overall score up or down.
3.7.1 Technical SEO (55% of Technical)
Robots.txt, sitemap.xml, canonical tags, hreflang, structured data validity, mobile-friendliness, indexability.
<meta name="robots" content="noindex"> on production. The Pro Site Audit tool is perfect for spotting these across a whole site.
3.7.2 Accessibility (30% of Technical)
Automated accessibility audit - colour contrast, ARIA labels, keyboard navigation, semantic HTML, form labels.
3.7.3 Best Practices (15% of Technical)
Automated best-practices audit - HTTPS, no console errors, valid source maps, no deprecated APIs, secure form handling.
3.8 Performance (6% of total)
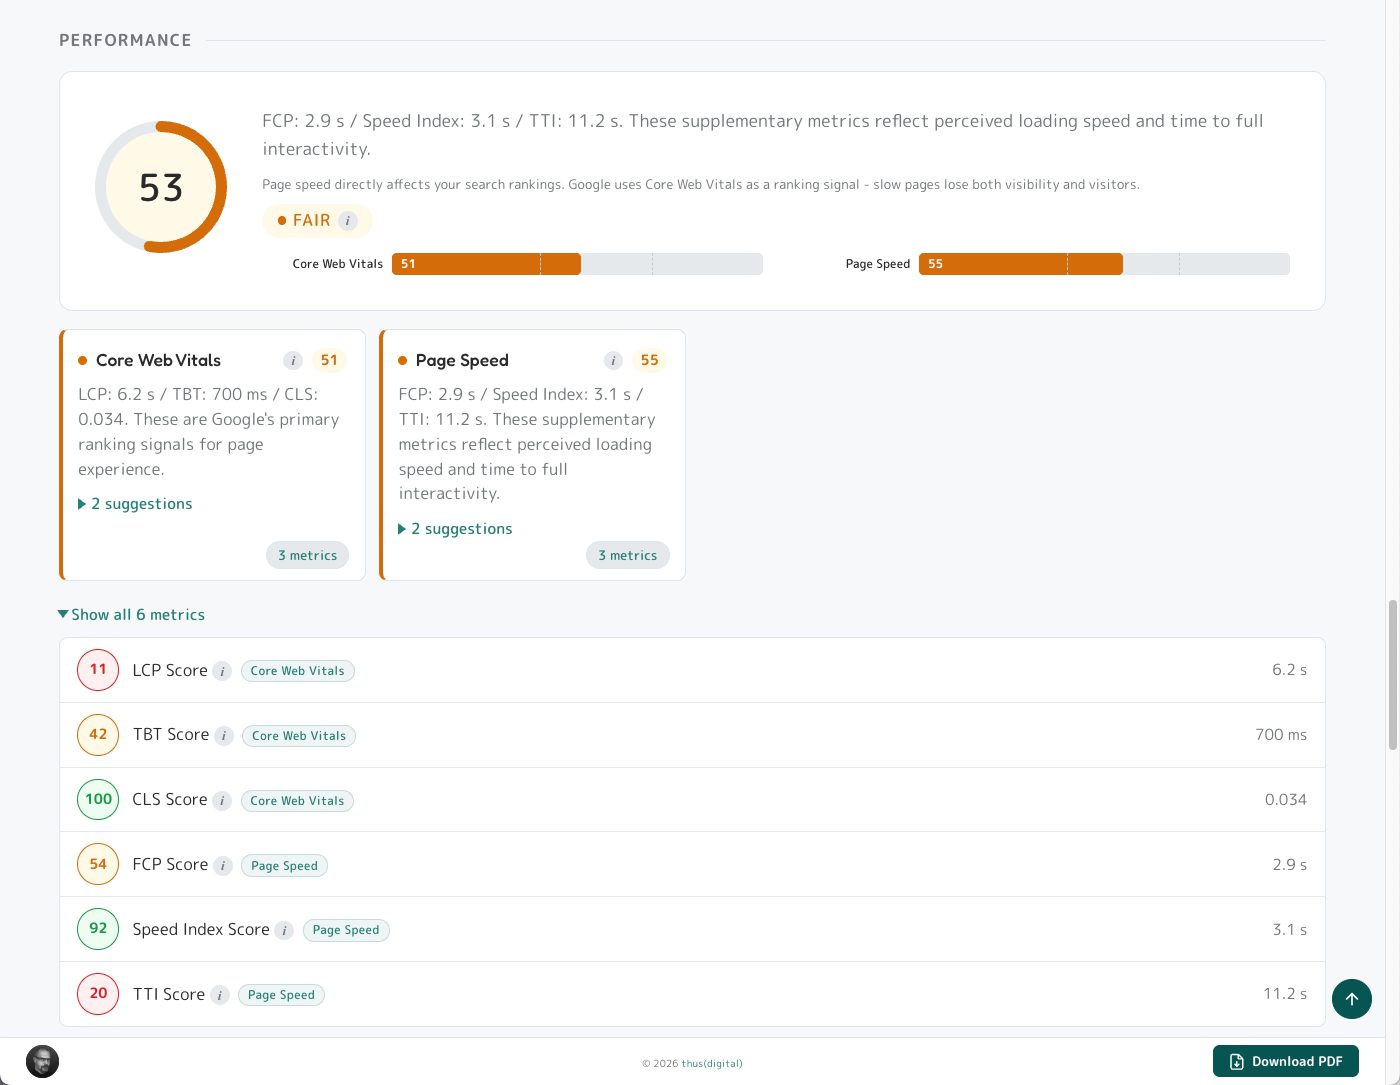
Page load speed and rendering quality measured during the scan, split into Core Web Vitals (Google ranking signals) and supplementary speed metrics. Same fallback as Technical: if a dimension can't be measured (login-gated pages, heavy JavaScript, server timeouts), it gets a neutral score of 50 so it doesn't skew your overall score.
3.8.1 Core Web Vitals (60% of Performance)
LCP (Largest Contentful Paint, target <2.5s), TBT (Total Blocking Time, target <200ms), CLS (Cumulative Layout Shift, target <0.1). Google uses these as direct ranking signals.
3.8.2 Page Speed (40% of Performance)
FCP (First Contentful Paint), Speed Index, TTI (Time to Interactive). Don't directly rank but reflect perceived speed.
3.9 Keyword Opportunity
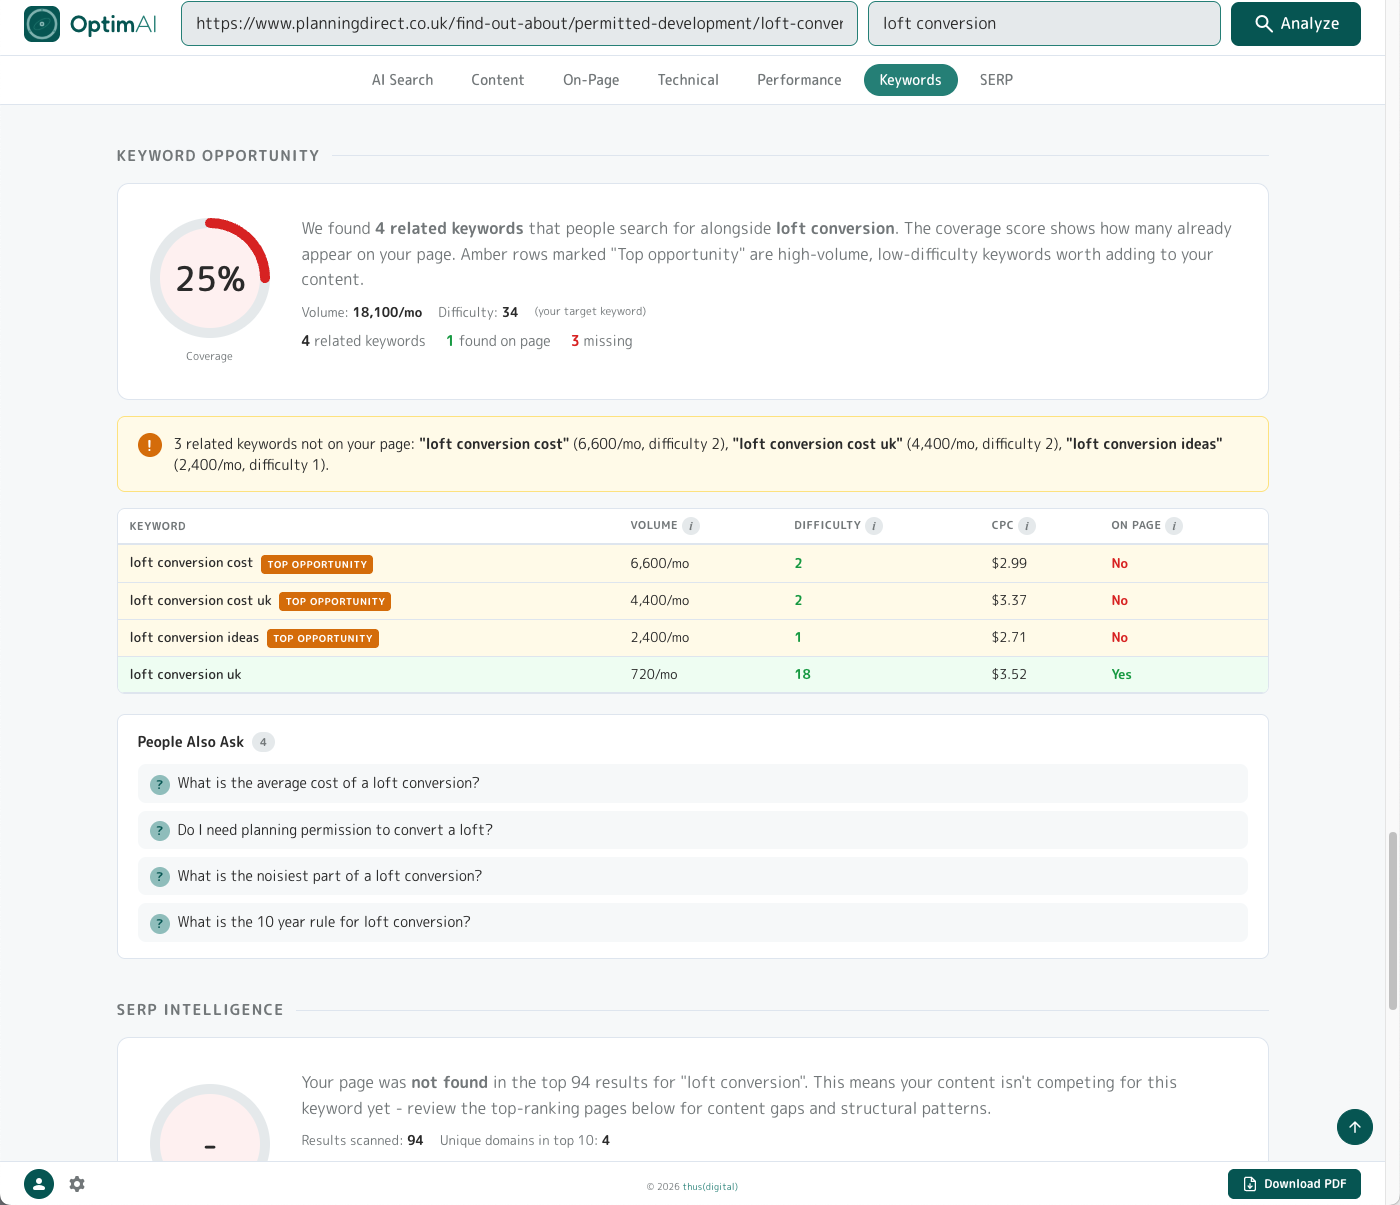
After the 5 scoring categories, the Keyword Opportunity panel lists related keywords people search for alongside your target, with a coverage score showing how many already appear on your page.
Why it matters: each related keyword is a real search query where people could find your page - but only if your content actually mentions it. Every variant in the table that your page doesn't cover is a door you're not opening. Adding the high-volume, low-difficulty ones you're missing is one of the cheapest ways to get ranked for more searches at once - you're not writing new pages, you're just making sure the page you already have is visible to more of the traffic that's already looking for what you do.
Layout: a coverage gauge (top), stats row, insight callout, variants table (best related keywords with monthly search volume, difficulty 0-100, CPC, and "On Page" yes/no - top opportunities flagged automatically), and a People Also Ask list from Google's PAA box. If there isn't enough related search data for your keyword (usually very narrow branded queries), the panel simply doesn't appear on the report.
Tip: Keyword specificity matters as much as keyword breadth - ambiguous keywords pull variants from the wrong topic universe entirely.
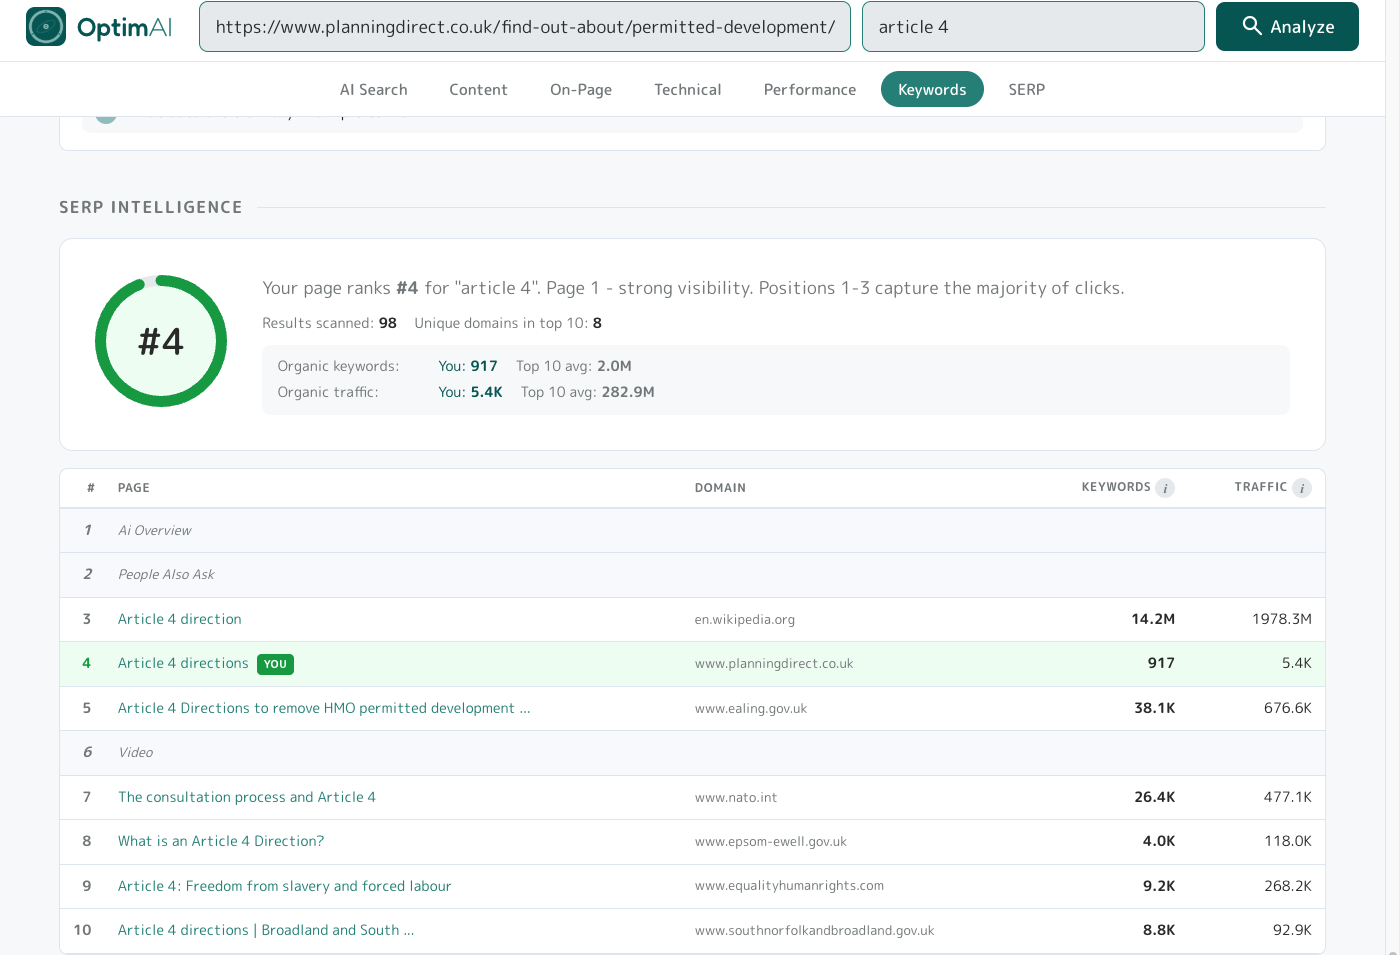
Example: a UK planning page scanned for "article 4" returns data about US Constitutional law (Article IV - interstate commerce, fugitive clause) instead of UK Planning Article 4 Directions. Same two words, two completely different topics.
If your suggestions look off-domain, add a disambiguating qualifier so the engines know which universe you're in ("article 4 directions", "article 4 planning", "article 4 HMO").
This applies across the whole report, not just the Keyword Opportunity panel - AI Search Opportunity and SERP Intelligence are equally susceptible to homonyms.
3.10 SERP Intelligence
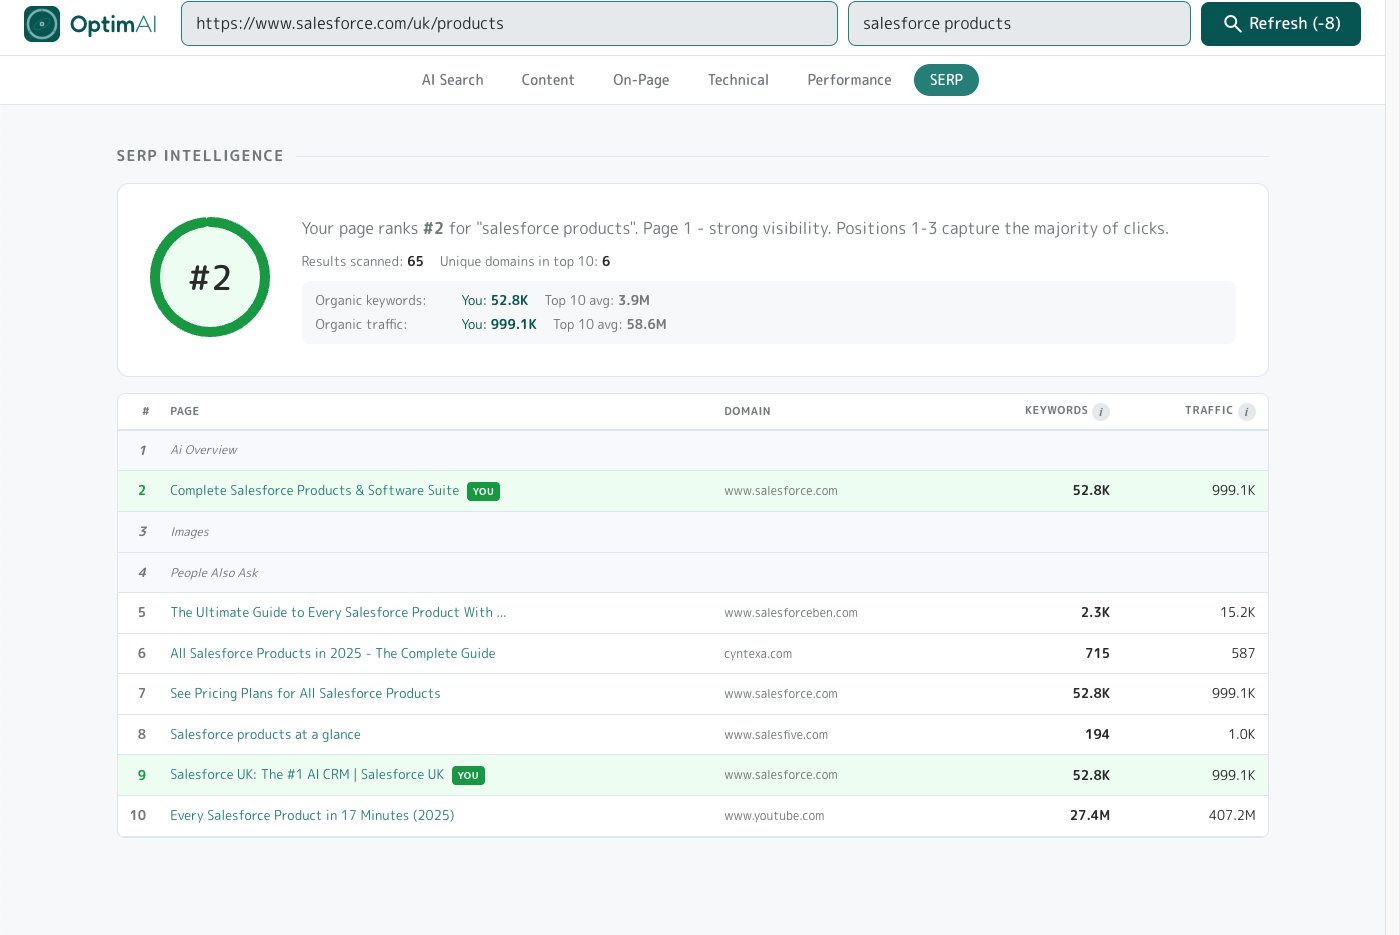
The "what does the SERP actually look like for this keyword" view. Pulls live Google results for your keyword + region, finds your page's position (if it ranks), and shows the top 10 with competitor metrics.
Keyword specificity: one page, two keyword variants
To show how keyword choice alone can move a ranking, here's the same Planning Direct page (/find-out-about/permitted-development/article-4-directions) scanned against two related keywords. Same HTML, same content, same domain authority - only the keyword changes.
Variant 1 - ambiguous keyword "article 4": ranks #4, but the SERP is polluted with off-topic results. Wikipedia's "Article 4 direction" (#3, planning-relevant), Ealing Council (#5), NATO's "consultation process and Article 4" (#7, completely different Article 4), Equality & Human Rights' "Article 4: Freedom from slavery and forced labour" (#9, yet another unrelated Article 4). Google doesn't know which "Article 4" the searcher means, so it serves a mix.
Variant 2 - specific keyword "article 4 directions": rank jumps to #2 (up from #4) and the competitor set cleans up completely - legislation.gov.uk, Dorset Council, London.gov.uk, Bristol Council, gov.uk. All UK planning, all authoritative, all directly relevant. Adding one qualifying word moved a real page 2 positions up the SERP AND eliminated four off-topic competitors.
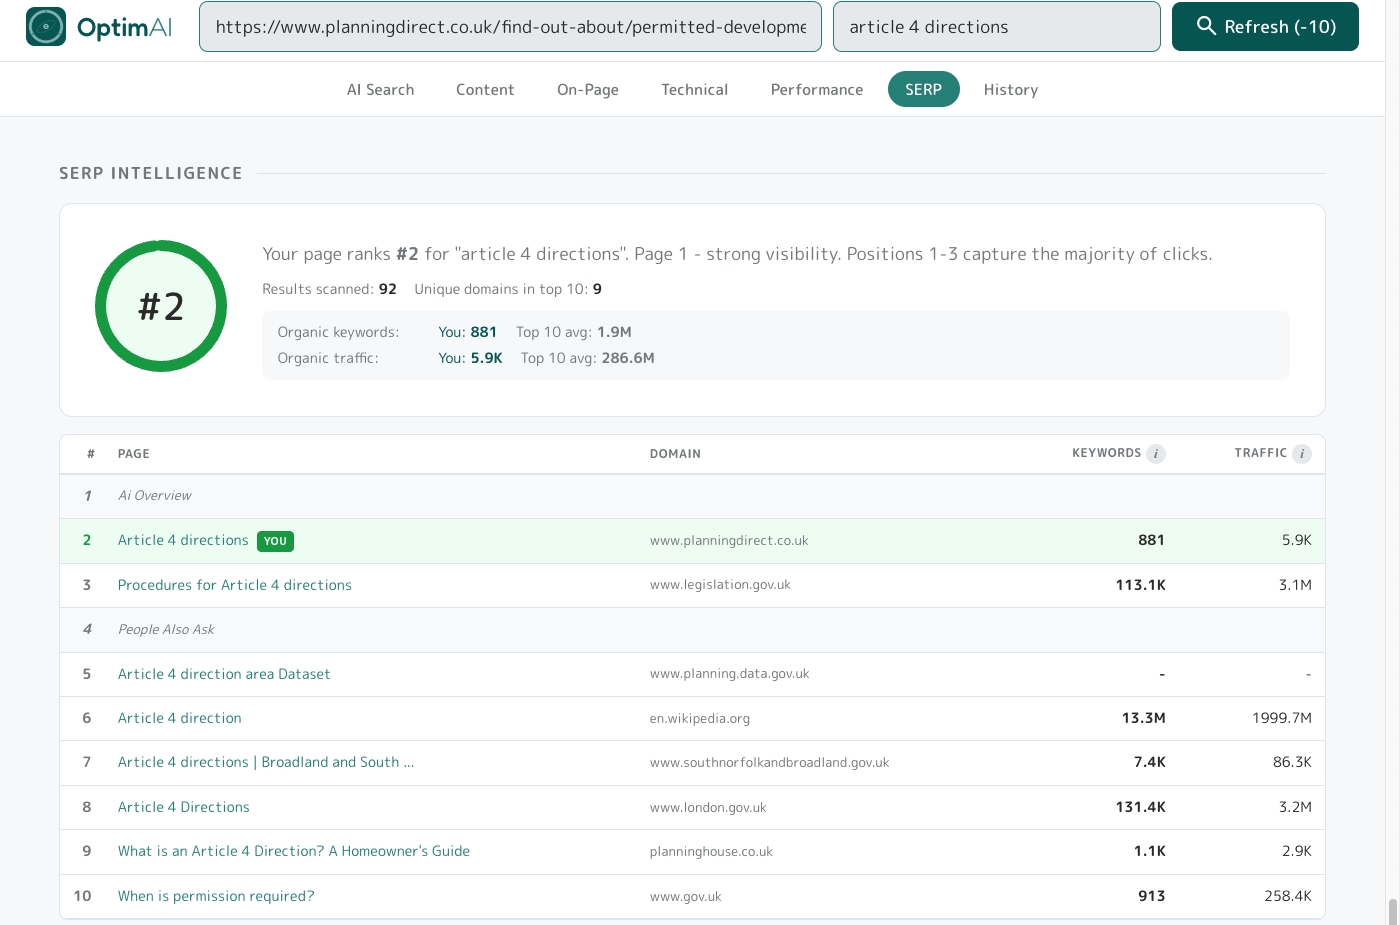
The specificity lesson: Variant 1 → Variant 2 is the move most pages have waiting for them. Not a content change, not a schema change, not a link-building project - just picking a keyword that matches the page's specific intent. Now you know the perfect target, apply it and optimise for it by following OptimAI scan suggestions and get cited more by AI and rank higher in Google!
The "not found" diagnostic: competitive SERP defeat
Specificity isn't the only trap. Here's a different Planning Direct page - /find-out-about/permitted-development/loft-conversion, a page explicitly about loft conversions - scanned against the obvious keyword "loft conversion". Result: not found in the top 94.
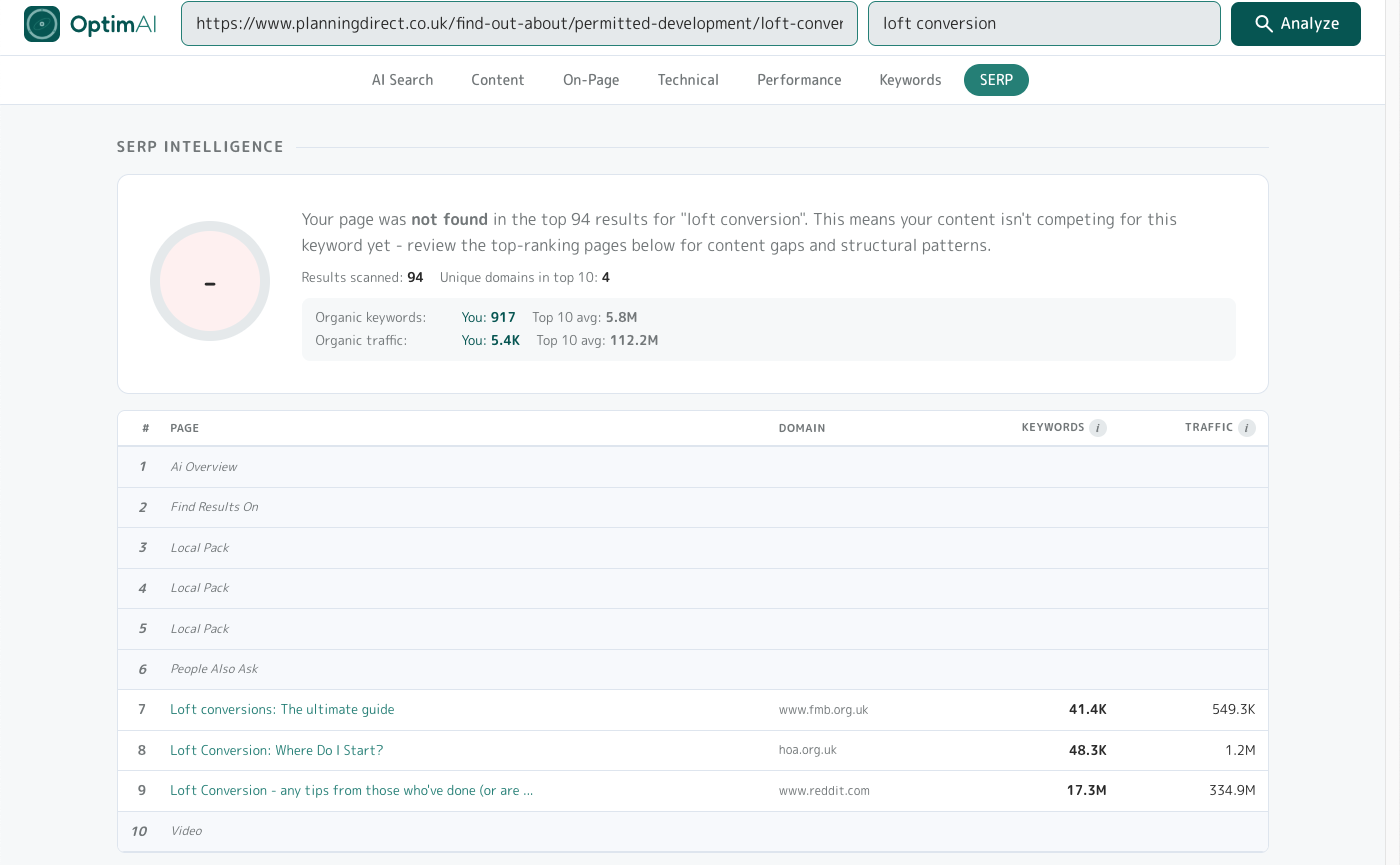
The keyword-page fit is correct this time - the page is literally about loft conversions. But the SERP is dominated by high-authority sites (Federation of Master Builders, HomeOwners Alliance, reddit) and local-pack business listings that Planning Direct can't outweigh on domain authority alone. This is a different failure mode: the page belongs in the SERP by topic, but the competitive ceiling is too high.
The diagnostic lesson: "Not found" doesn't always mean wrong keyword. Check the top 10 competitors - if they're all huge authority domains or local-pack listings you can't outrank, the realistic path is a long-tail variant ("loft conversion permitted development rules UK", "when do you need planning permission for a loft conversion") rather than the head term. SERP Intelligence shows you the ceiling before you spend months trying to reach it.
3.11 History
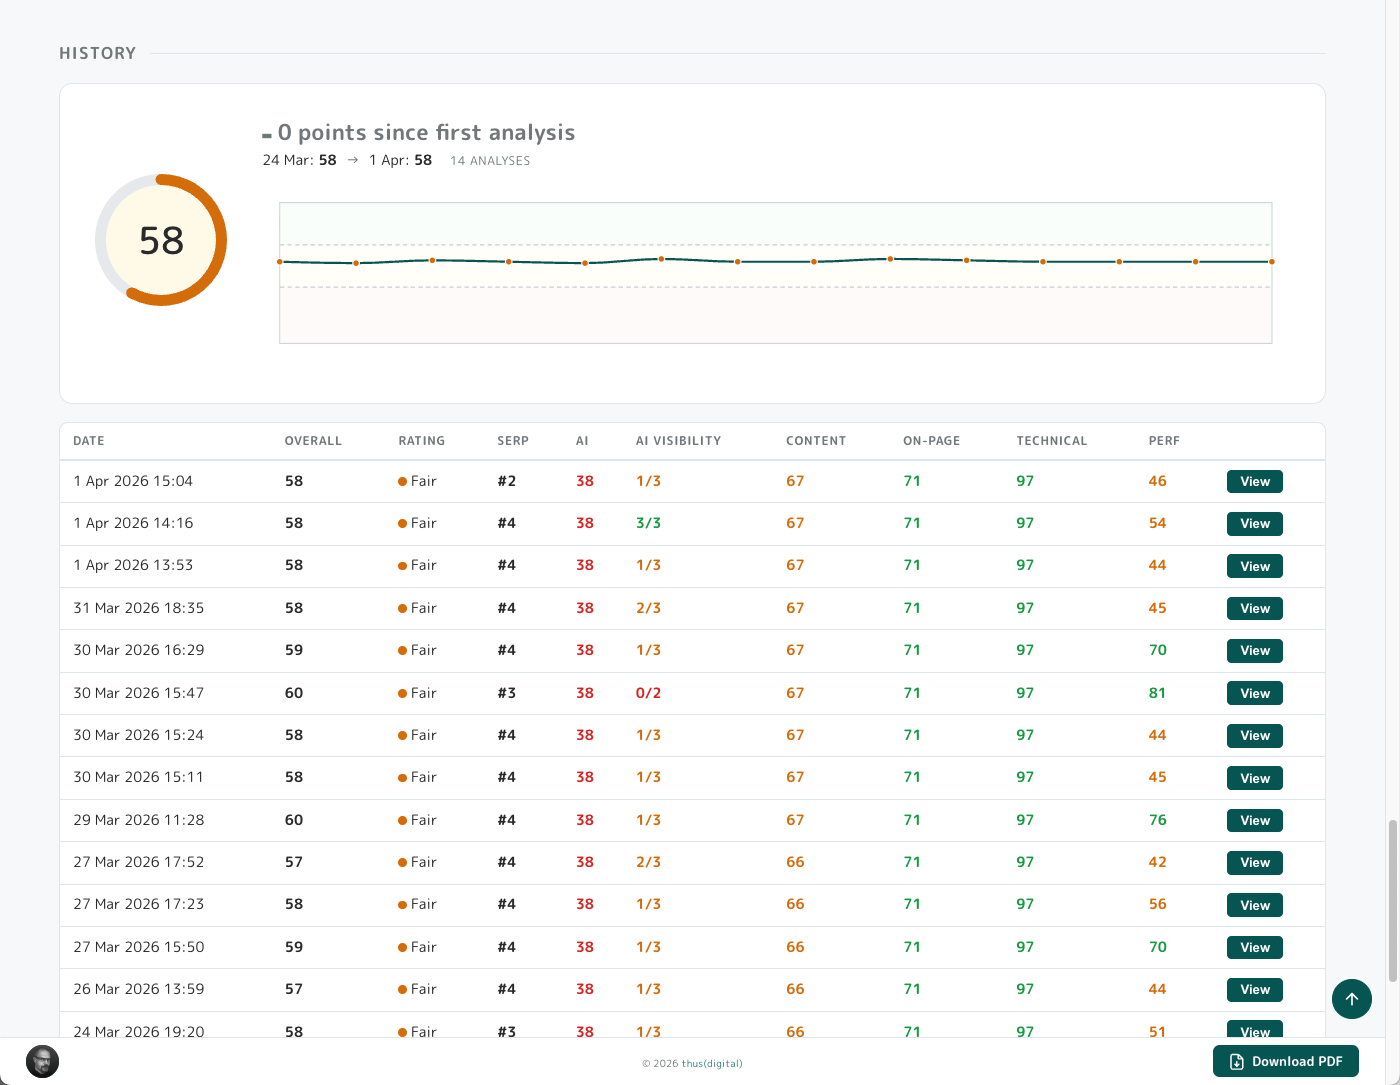
The History panel only appears when you have 2+ scans of the same URL+keyword pair. It tracks score changes over time so you can see whether your edits are moving the needle.
Layout: current score gauge with delta vs first scan, sparkline of overall score over time with red/amber/green bands at 40 and 70 thresholds, and a per-scan table with every historical scan (date, overall score, rating, SERP position, per-category scores, and a View button to open that historical report).
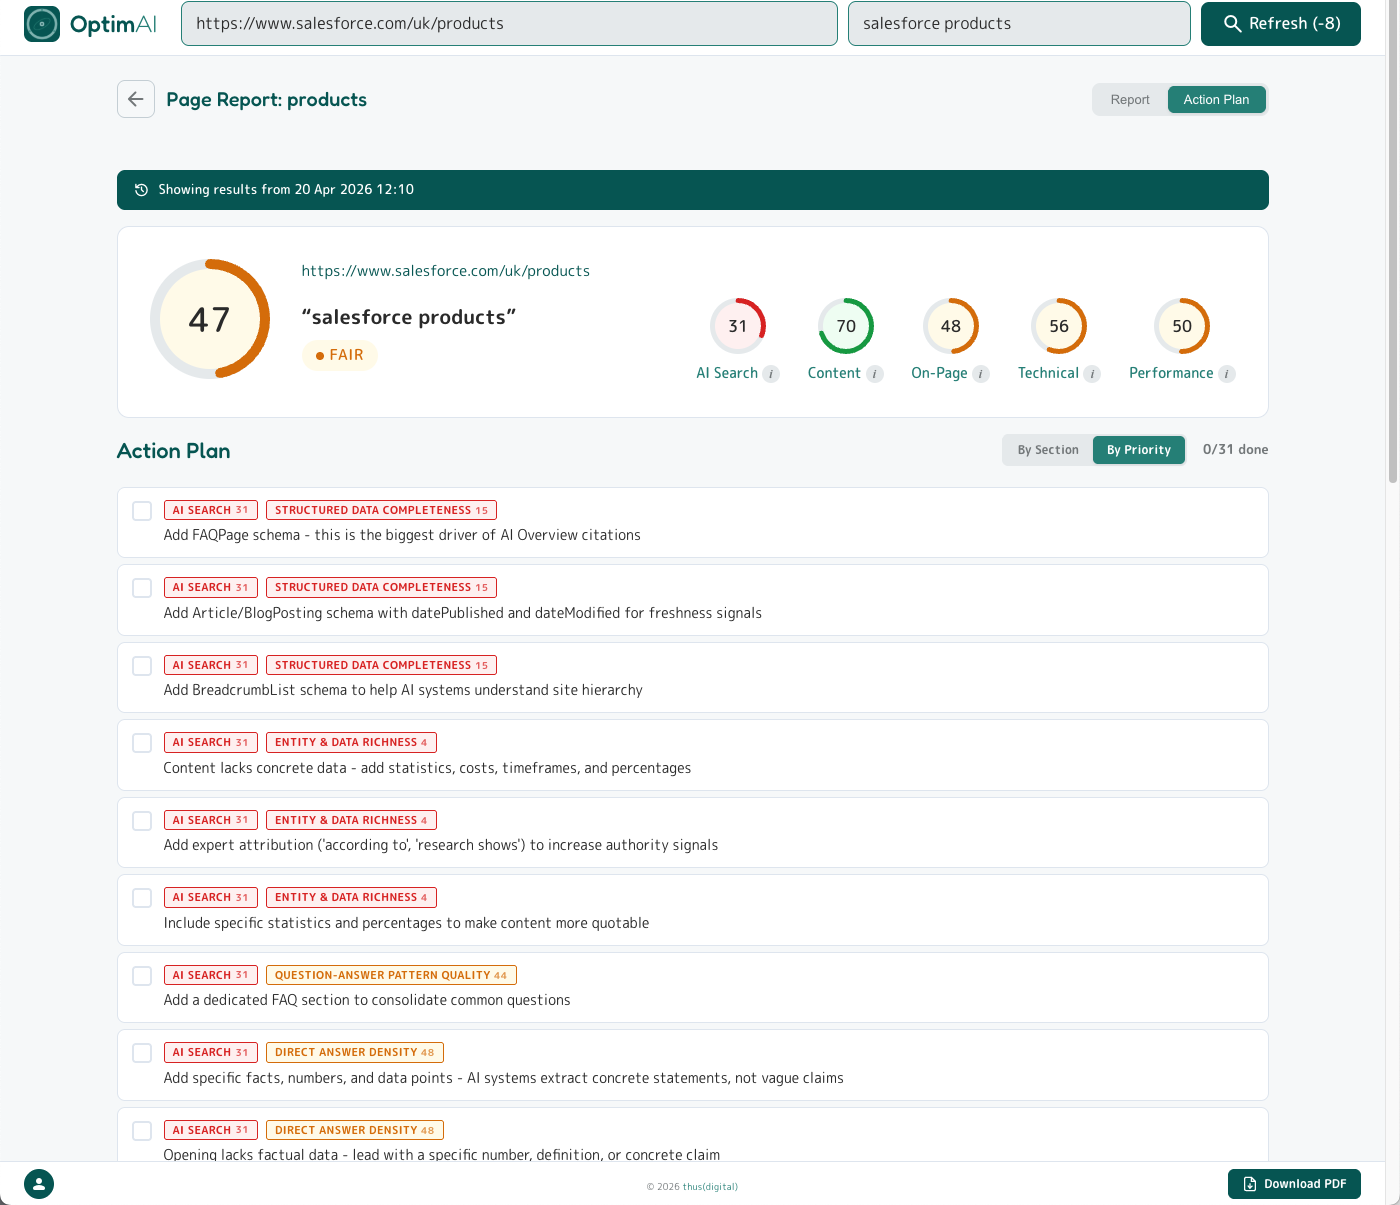
3.12 Action Plan
Nearly last but certainly not least, the Action Plan is the original reason we built OptimAI and probably the most useful feature.
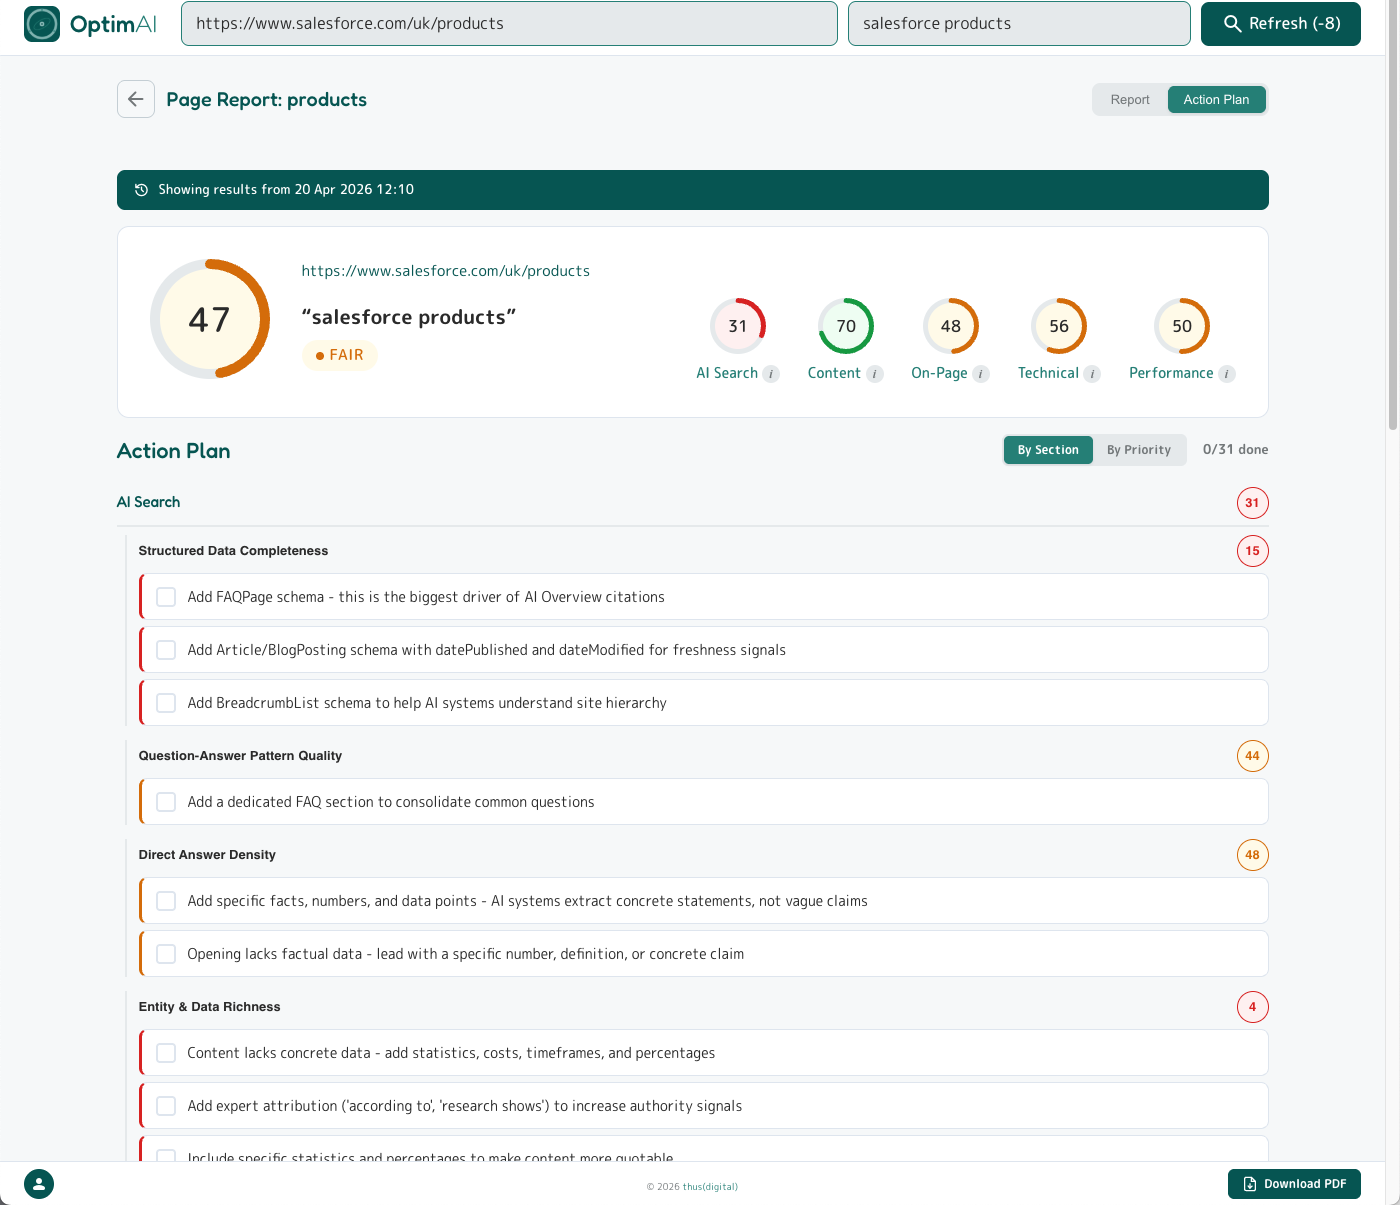
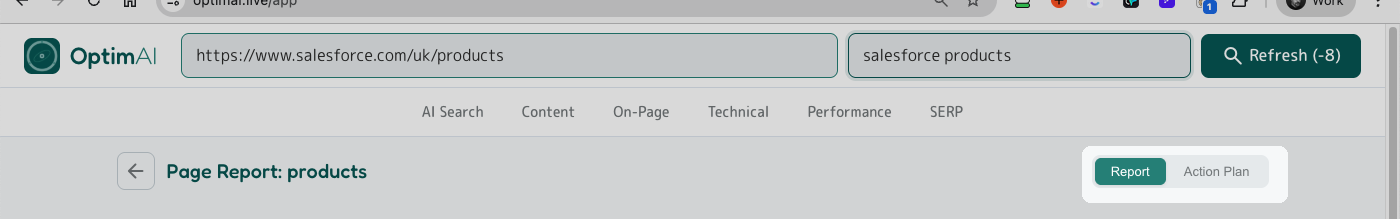
Top-right of the report has two tabs: Report (the deep view we've just walked through) and Action Plan - a stripped-down to-do list of every suggestion across the report.
The Action Plan offers two views, one sorted by category & dimensions (see above) and the other sorted by priority (see below). This helps you focus your work by moving systematically through dimensions, for example overhauling Content across a set of pages in one push, or by sweeping pages for the most critical fixes that will move the needle fastest.
You can tick off suggestions as you work through. OptimAI tracks these between scans so you can see at a glance whether each item is resolved, still needs work (the changes you made weren't significant enough to resolve the root cause), or is new - generated since the last scan.
Tip - a few important things to remember:
- Suggestions are dynamic. The system updates progressively as you optimise your pages - you don't need to obsess about resolving every single one. Aim to get each category green overall; the list will surface the most significant issues naturally.
- Fixes often overlap. Resolving one issue can quietly resolve others at the same time - don't chase perfection.
- Work methodically: focus on a related batch of changes at a time (either by type or priority), rescan, see the progress, then pick the next batch.
3.13 Download PDF

Finally the Download PDF button - does what it says on the tin! The bottom-right of every report has a Download PDF button which generates a PDF copy of the full report - same scores, same explanations, same tip text - rendered as a clean print-friendly document. It also includes the full Action Plan so you have a handy cheat sheet to work from.
Tip: Pro/Partner tier unlocks white-label PDFs - your branding (logo, colours, our footer removed) instead of OptimAI's. Covered in detail in Section 4 below.
The PDF is arranged with page breaks between each section so you can easily cut out pages you don't need using a tool like ilovepdf.com.
4. Pro Tier
Everything covered so far works on every tier. This section covers what Pro and Partner tiers add: whole-site audits, batch scanning, branded reports, and team workspace sharing. If you're scanning more than a handful of pages a month, or reselling audits to clients, these are the features that make the work repeatable and presentable.
4.1 Standard vs Pro vs Partner at a glance
| Standard | Pro | Partner | |
|---|---|---|---|
| Site audit + page tree view | - | yes | yes |
| Sitemap export | - | yes | yes |
| Batch scanning | - | yes | yes |
| Batch PDF download | - | yes | yes |
| White-label PDFs | - | yes | yes |
| Unlimited summary reports | - | yes | yes |
| Domain intelligence | - | yes | yes |
| Domain keyword opportunities | - | yes | yes |
| Site health audit | - | yes | yes |
| Team report sharing | - | yes | yes |
| Credit pooling | - | yes | yes |
| Billing | credit packs | credit packs | monthly subscription |
| Credit rate | 1x | 1x | 1.5x |
| Early access research | - | - | yes |
| Early access new features | - | - | yes |
The biggest line isn't a feature - it's the credit rate. Partner subscribers get 1.5x credits for their money compared to pack purchasers. £500/month on Partner buys 750 credits; £500 of credit packs buys 500. If you're running more than ~20 analyses a month, Partner is almost always the better economics and brings scan and refresh costs back to parity with Standard tier pricing.
4.2 Partner subscriptions
Partner is our self-serve monthly subscription for agencies, consultants and in-house teams running regular audits. Here's how it works:
- Credits arrive on your billing day each month
- Credits never expire - unused credits roll forward indefinitely
- Cancel any time via the Stripe customer portal - your balance stays, you drop to the Pro tier
- Had a busy month and need just a few more scans? You can always top up mid-month with regular credit packs for that bit extra.
- VAT applies at 20% on GBP transactions; USD is VAT-exempt (rest of world)
- Need more than the self-serve tiers? Contact us for custom pricing
- Keep all your historic report data regardless of tier. You paid for it so it's yours forever.
4.3 Pro Dashboard
Pro tier has a slightly different dashboard with two levels: the top level shows your scans grouped by domain with aggregated values. Click on a domain row to drill down into a table listing the scans run for just that domain - otherwise the same as the standard tier dashboard, including the filter to quickly find scans.
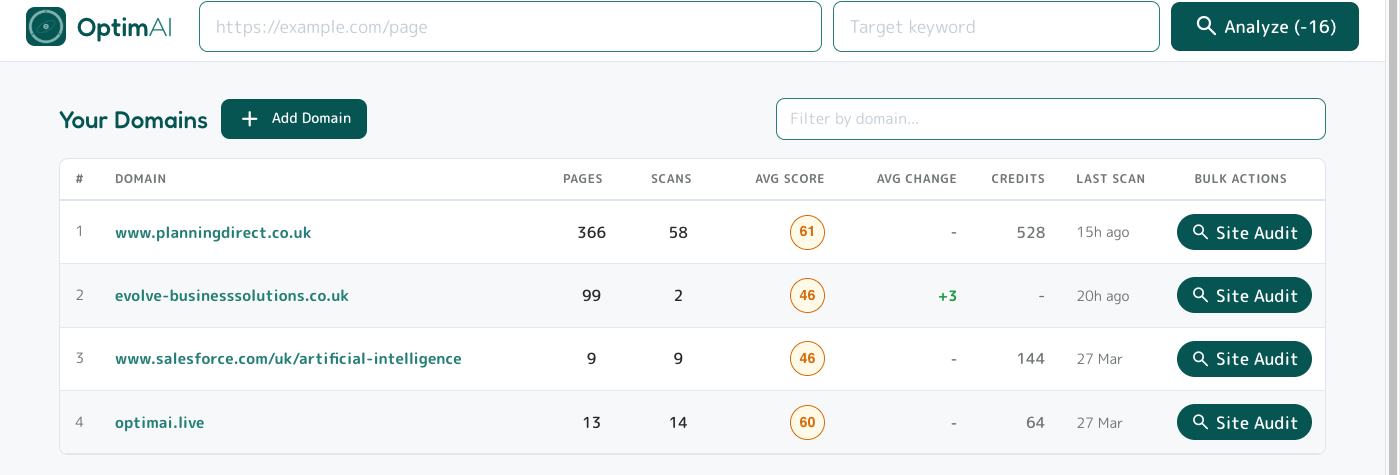
From the domain dashboard you can also add a domain directly to run a site crawl. This will display the Site Audit page tree (more on this below). You can also enter this view for any existing domain in the list by clicking the Site Audit button in the table.
If you've already run a single-page scan, the domain will already be listed here and you'll find the scans on the drill-down for that domain - no need to re-add via the Add Domain button.
4.4 Site Audit - Pages tab
The page tree (or Pages tab) within Site Audit is your main place to overview the latest state of your scanned pages for that domain (or subdirectory/section) and run bulk operations.
At the top of every tab within Site Audit you will see domain level metrics: backlinks, domain rank, referrers and anchor text, etc. All standard stuff, except you don't get charged extra for it, unlike with some other tools! Next there is a large amber panel explaining how to use the bulk tools - you can dismiss this once you are familiar, and if you need a reminder just pop back here to these help documents.
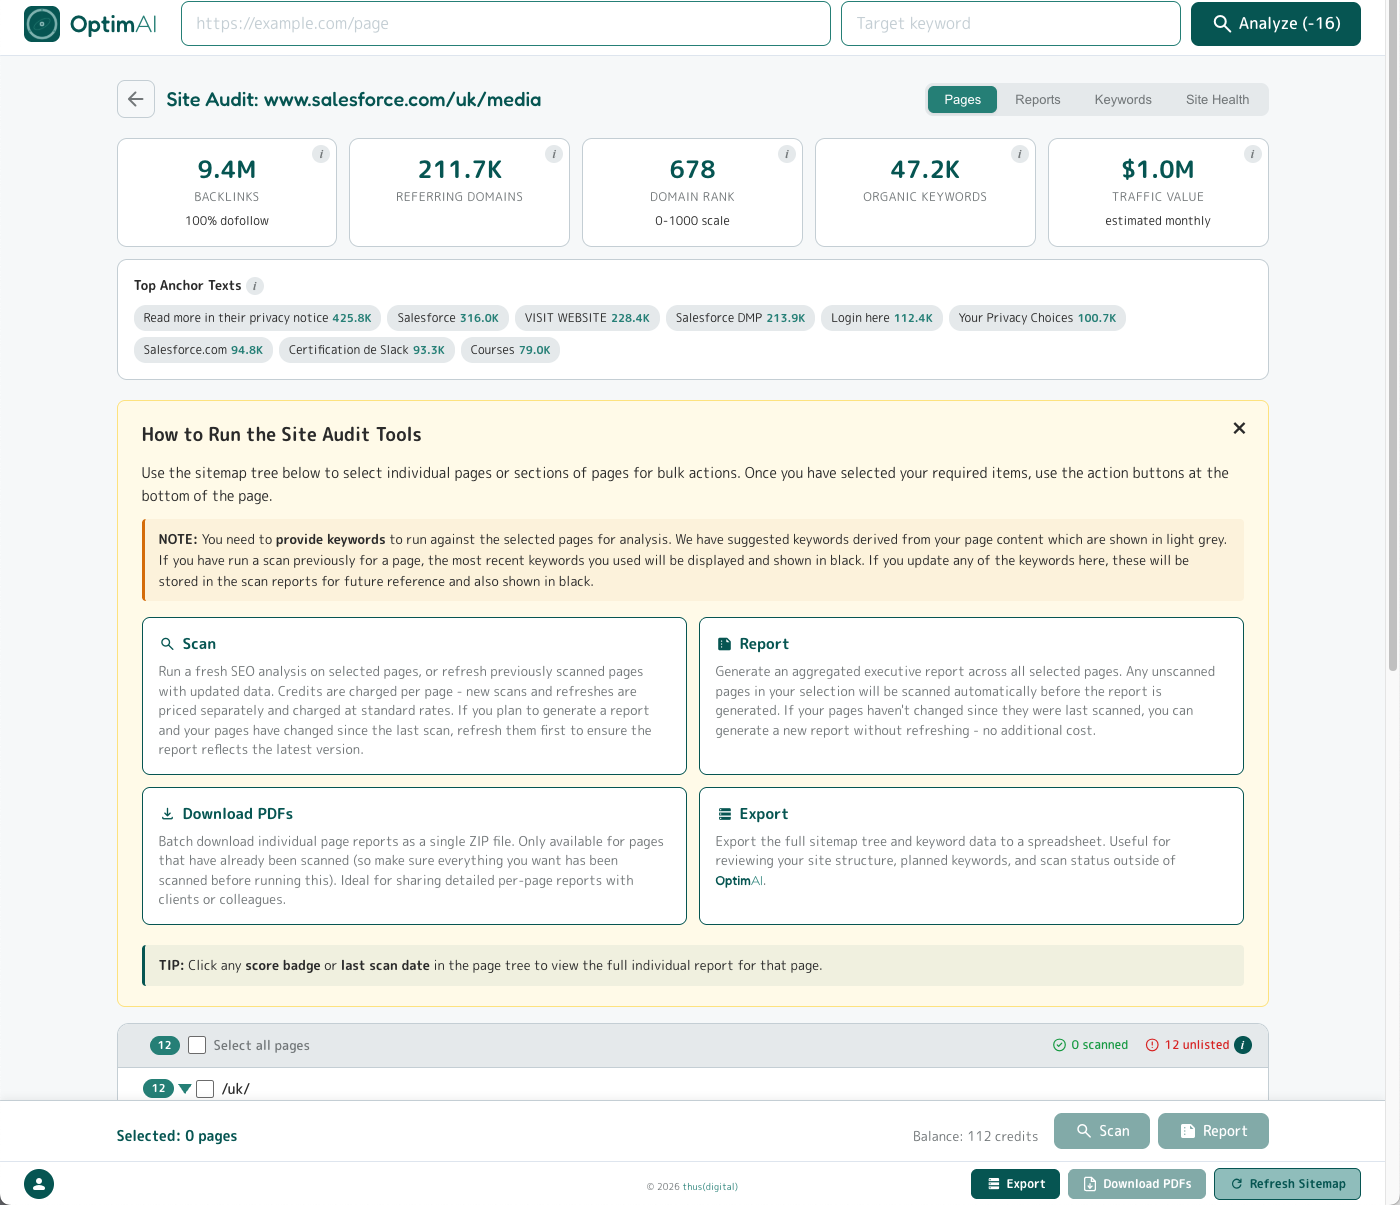
After the explainer panel (or after the domain stat cards once you've dismissed it, as in the image below) you'll see the page tree, which is a sitemap displayed in a similar way to a file and folder tree on your computer. You use this to select pages you want to perform bulk operations on (e.g. batch scan, summary reports or batch PDF downloads) by clicking the checkboxes.
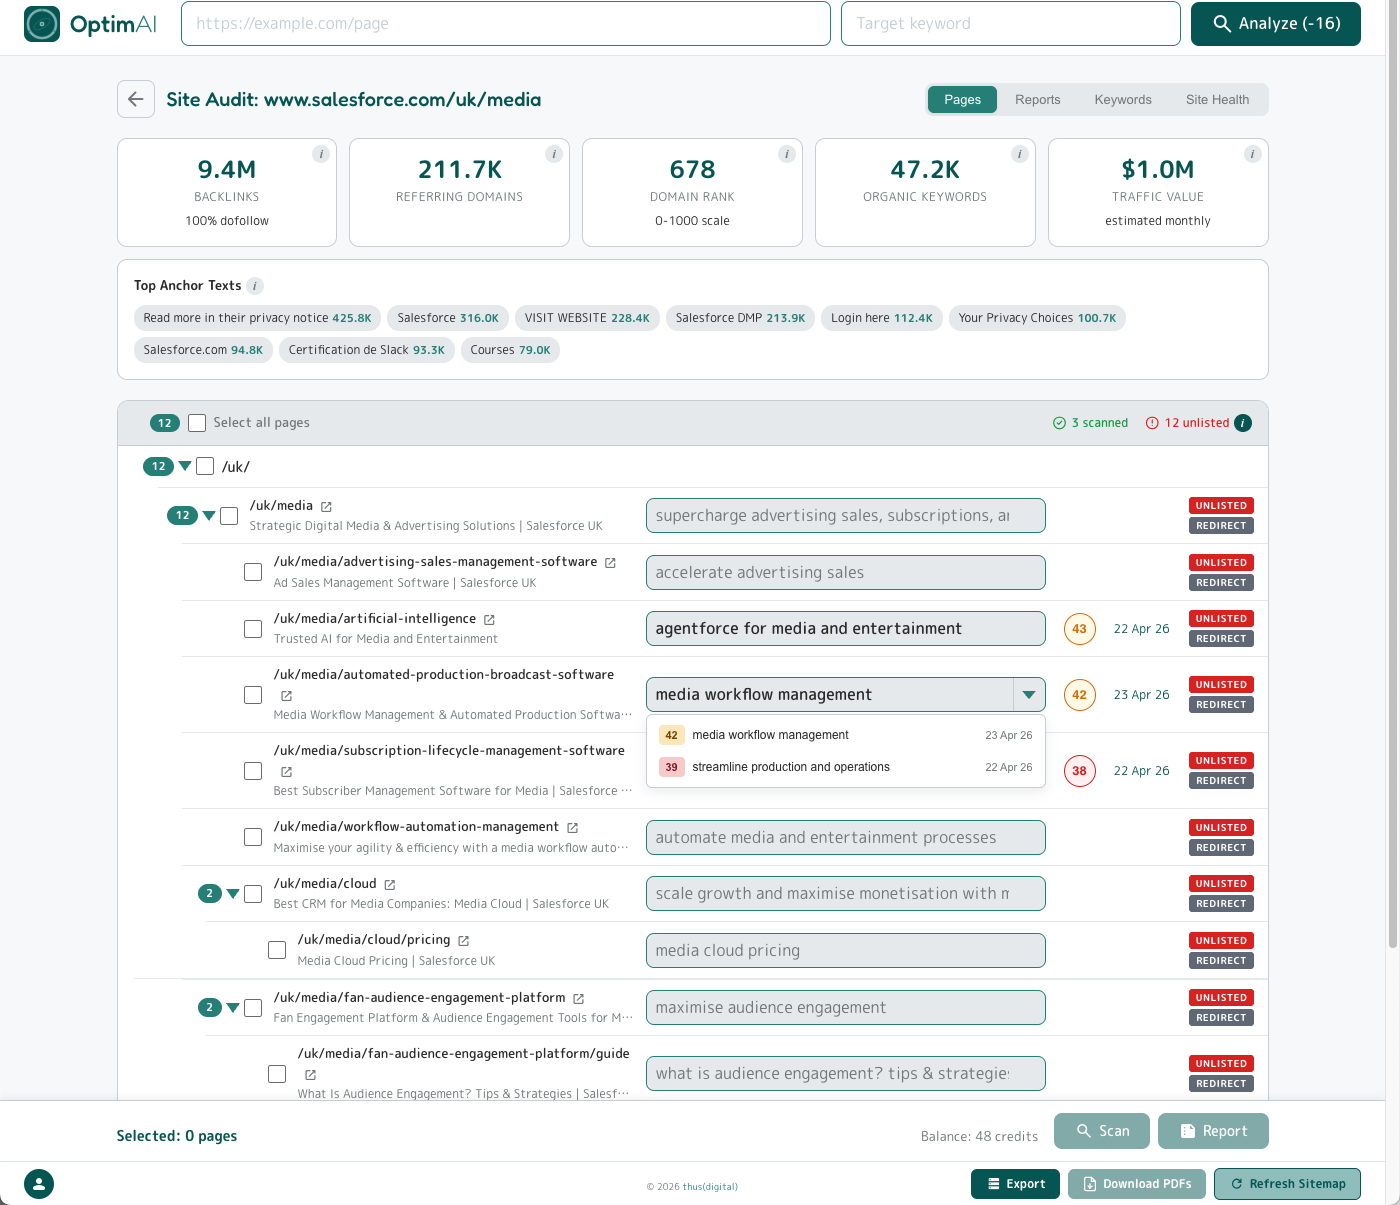
Tip: You can expand and collapse the page tree at subdirectories (i.e. "sections") using the arrow for quicker scrolling. Subdirectory pages also show the count of "child" sub-pages (including the top level "parent") in the pill badge on the left. Selections cascade through all child pages.
The top of the page tree table also shows you the count of pages which have been scanned and the total number of unlisted pages.
Each row in the table shows the page path (with an icon to open the target page in a new tab), the page title we detected, and a text input for the keyword. If a scan has been performed on that page before, you will also see the Score Bubble for the most recent scan matching that page and keyword pair, and the date of that scan. Clicking the Score Bubble will take you to that specific page report.
If you have run a scan against a page for multiple keywords, the keyword input will become a drop down and allow you to select which keyword report to include. (In the screenshot above you can see this for the page /uk/media/automated-production-broadcast-software.)
For pages which have not been scanned we auto-detect a keyword suggestion (derived from the page's H1 heading, with fallback to the meta title or the URL slug if no H1 is present) which will be shown in grey text. For pages which have been scanned the keyword which was used will be shown in black text. Any text you enter here will be black and used for the batch scan when you trigger it.
4.4.1 Site Audit - Pages -> Export
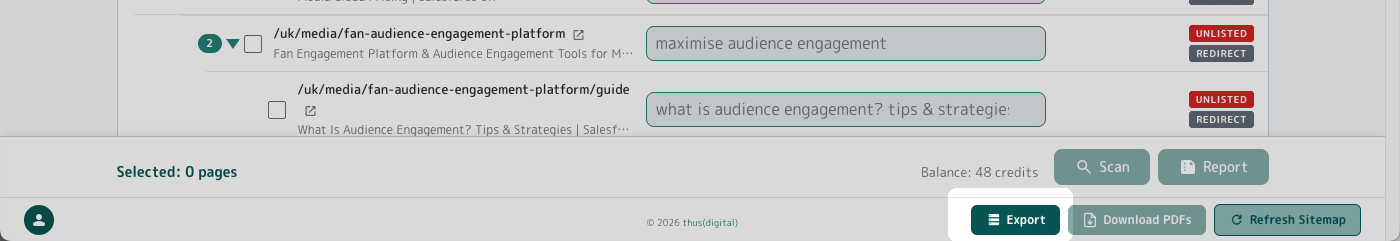
Click the Export button (bottom right) to generate a Google Sheets version of the page tree sitemap. This will open in a new tab from where you can make a copy to edit or download as an Excel file. It includes checkboxes to select pages and a formula which calculates the credits required (including new scans or refreshes of previous scans at the different costs).
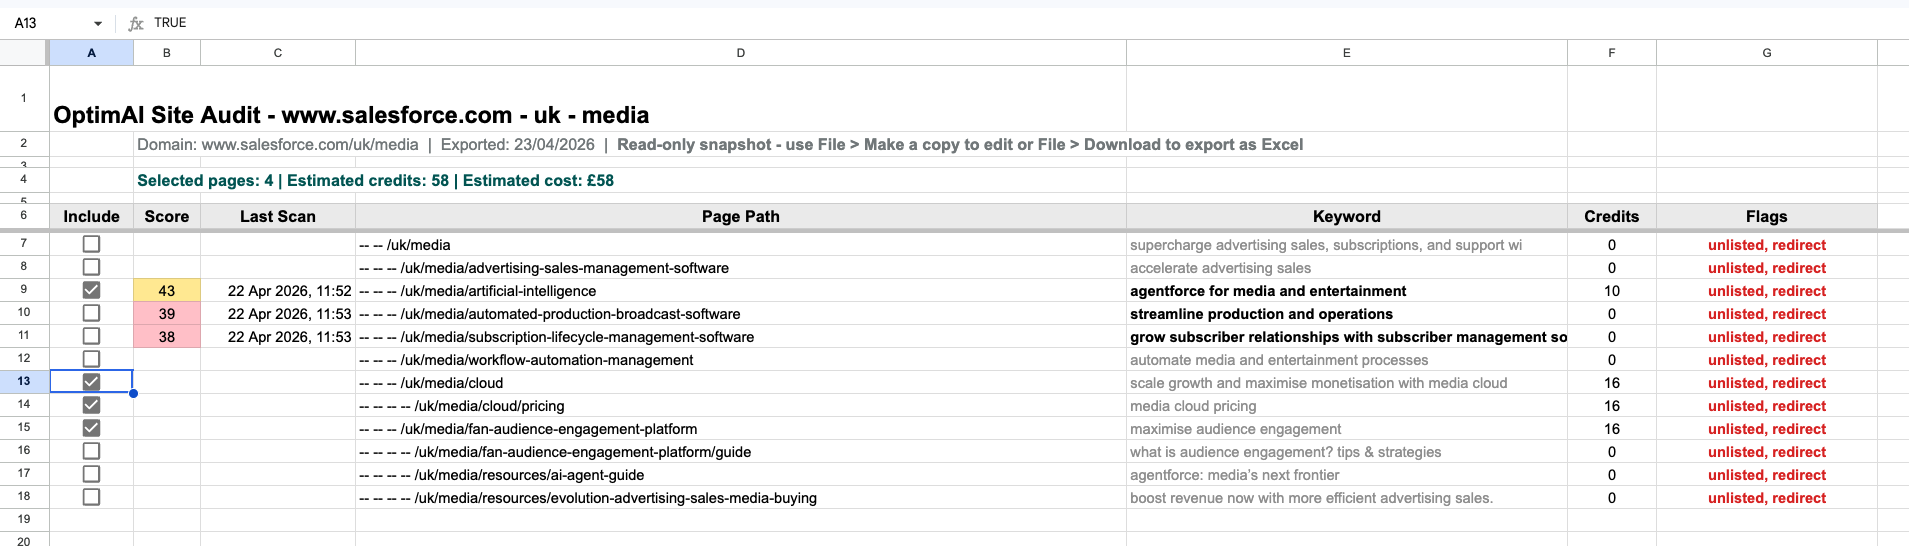
This is great to share with your team and plan your keyword strategy - for example listing out keyword variations you may want to run (just duplicate the original row). The file is formatted to follow the same grey/black keyword colouring as the live page tree, indicating suggested versus user-entered keywords.
4.4.2 Site Audit - Pages -> Download PDFs
Select some pages in the tree map and the Download PDFs button (next to the Export button, bottom right) will be enabled. Click it to download all the individual page report PDFs for each page selected in one zip file. (Note: if you have selected pages for which no scan has been run these will not be included, as there is no PDF generated from non-existent scans!)
4.4.3 Site Audit - Pages -> Scan
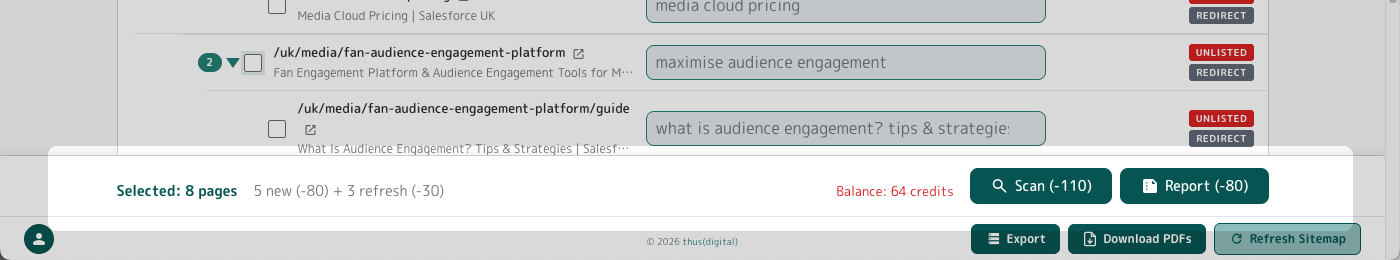
With some pages selected, the Scan and Report buttons will be enabled. They are found at the bottom of the page in what we call the Budget Bar - this does the maths for you and calculates the cost based on new scans and refreshes, showing the total cost in the Scan button itself and also your current balance (red if insufficient credits).
Click the Scan button to generate new page reports or refresh existing ones for the pages you have selected in the page tree. This runs as a batch operation which you can leave running in the background, as it may take some time. You can opt to receive an email notification when the batch is completed.
Remember to check your keywords before clicking! Once you click, the credits are deducted. (By the way, if any scans fail at any time you will get those credits automatically refunded.)
4.4.4 Site Audit - Pages -> Report
Reports run from the Site Audit page tree view are executive summary reports collating and aggregating the data from multiple individual page reports. You can generate an unlimited number of these reports for free, so you can slice and dice your site across whatever pages you like in as many ways as you like. We'll dive into further details about the summary reports below.
Tip: Running summary reports is free but you still need to have the individual page scan data to run a summary report against! The summary will use the most recent scan for the pages you have selected in the page tree. Remember to check keywords and switch to the variant you actually want for the summary if there are multiple historic scans against a page (using the drop down as explained above).
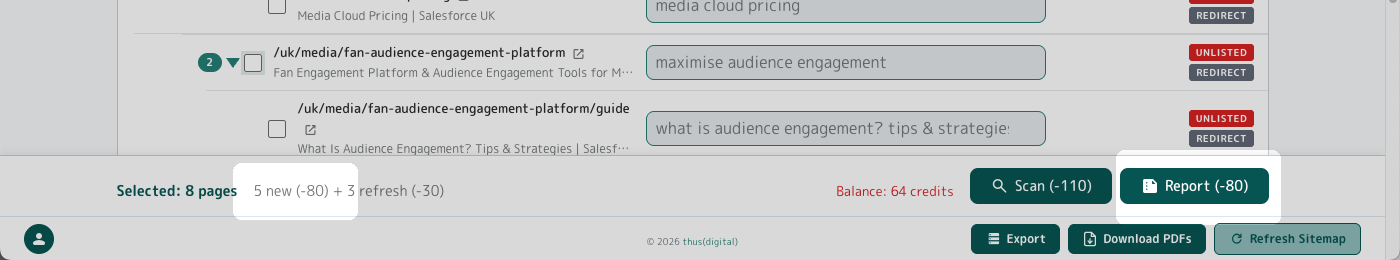
If you have selected pages that have not had a scan run yet, then you will be charged credits to run the initial scan so it can be included in the report. This is why you see a charge of 80 credits in the image above corresponding to the 5 new scans required by the pages selected in this case.
Also, don't forget to check the recency of previous scans before running a report - you may want to refresh some of these for the latest data first. The Report button will not automatically run refreshes for any existing scans.
4.5 Site Audit - Reports tab
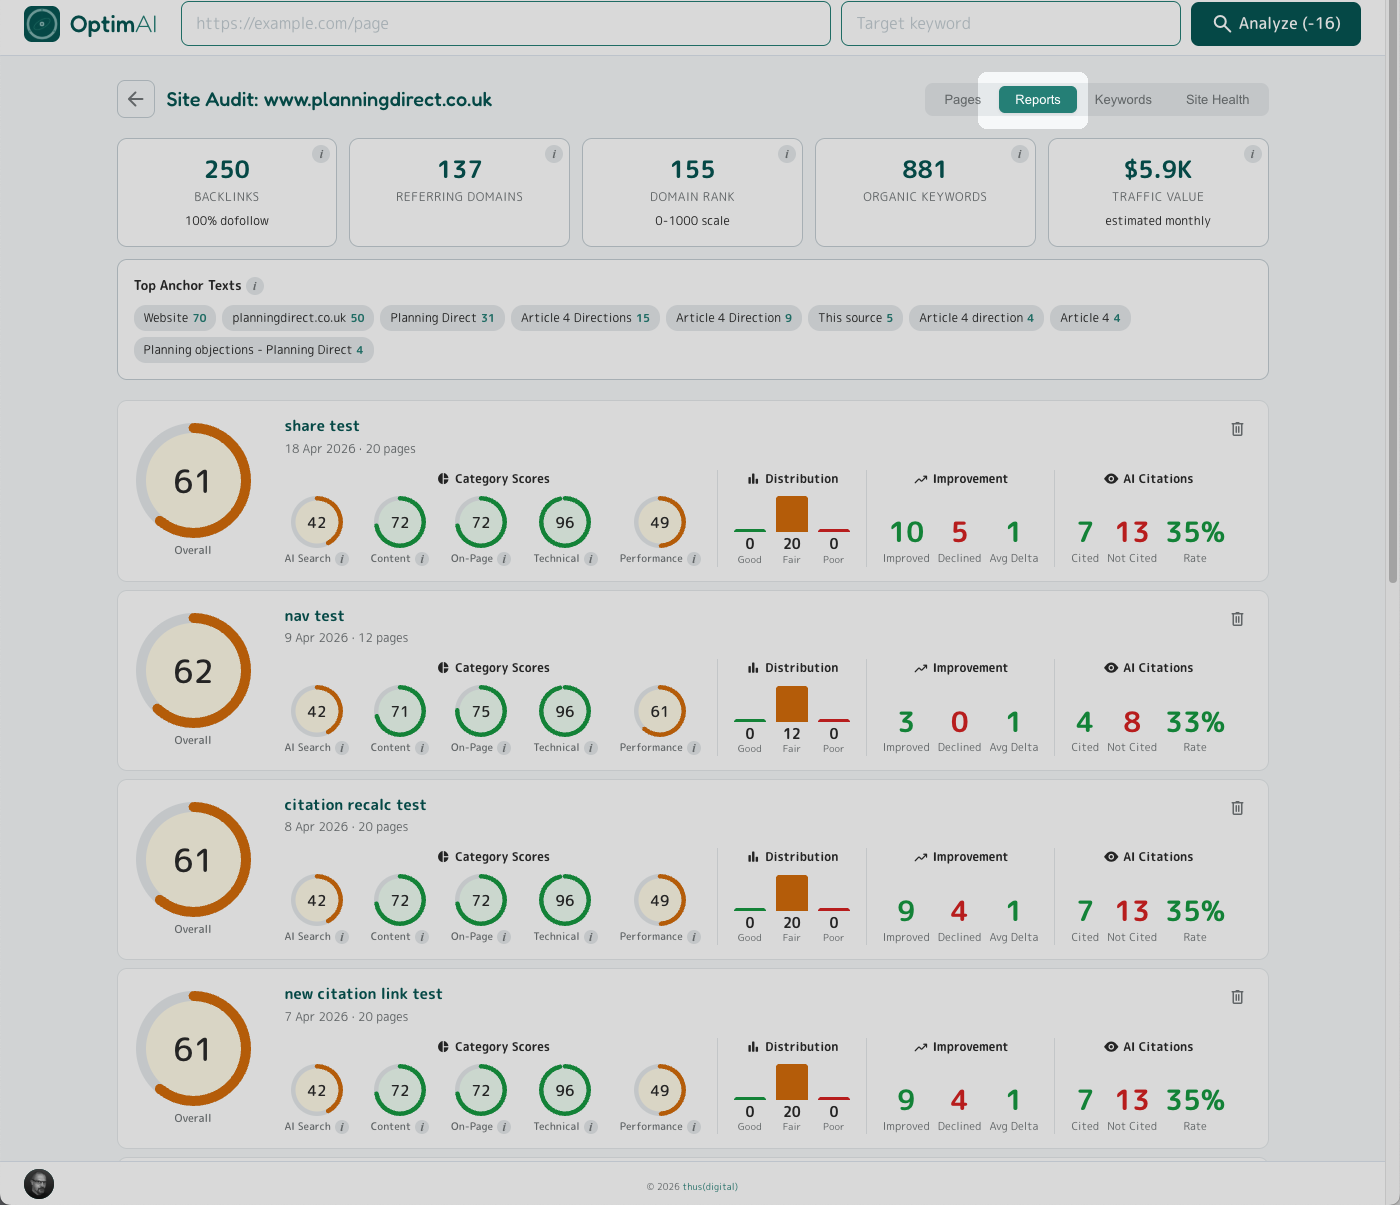
Clicking the Reports tab at the top right of the Site Audit page will take you to a listing of all previously-run executive summary reports. You will see a summary panel for every report showing headline results. Click the panel to view the full summary report. Click the trash can icon in the top right of a panel to delete a summary report (don't worry, all individual page reports will be preserved).
4.6 Site Audit - Keywords tab
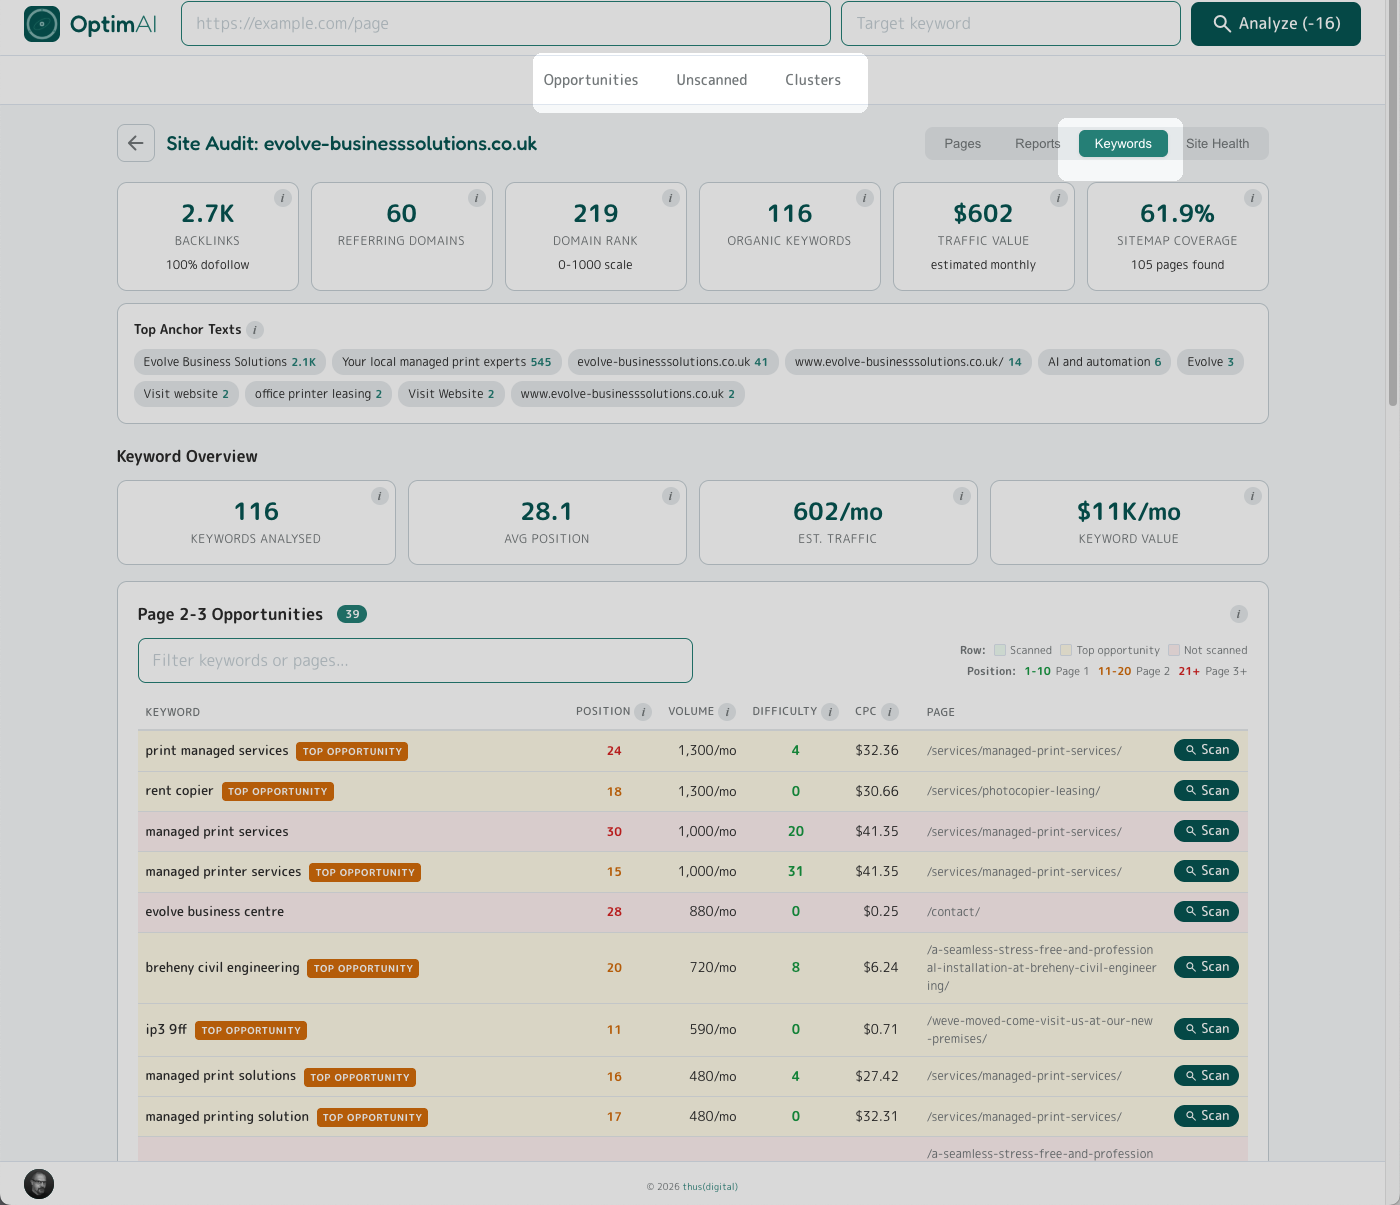
The Keywords tab is your domain-level keyword intelligence view - what the whole site is ranking for, which pages are pulling the rankings in, and where the biggest untapped opportunities sit across the entire domain. Essentially this is the site-wide version of the Keyword Opportunity panel in single page reports (see Section 3.9 above).
There are three sections, you can jump to each from the page nav highlighted in the image above:
- Opportunities - keyword-page pairs you're already on page 2 or 3 for and could get to page 1 of Google with a push
- Unscanned - pages on your site already ranking for keywords but not yet audited in OptimAI
- Clusters - thematic groupings of keywords, a lens on which topics your domain has authority in and where the gaps sit
4.6.1 Site Audit - Keywords -> Opportunities
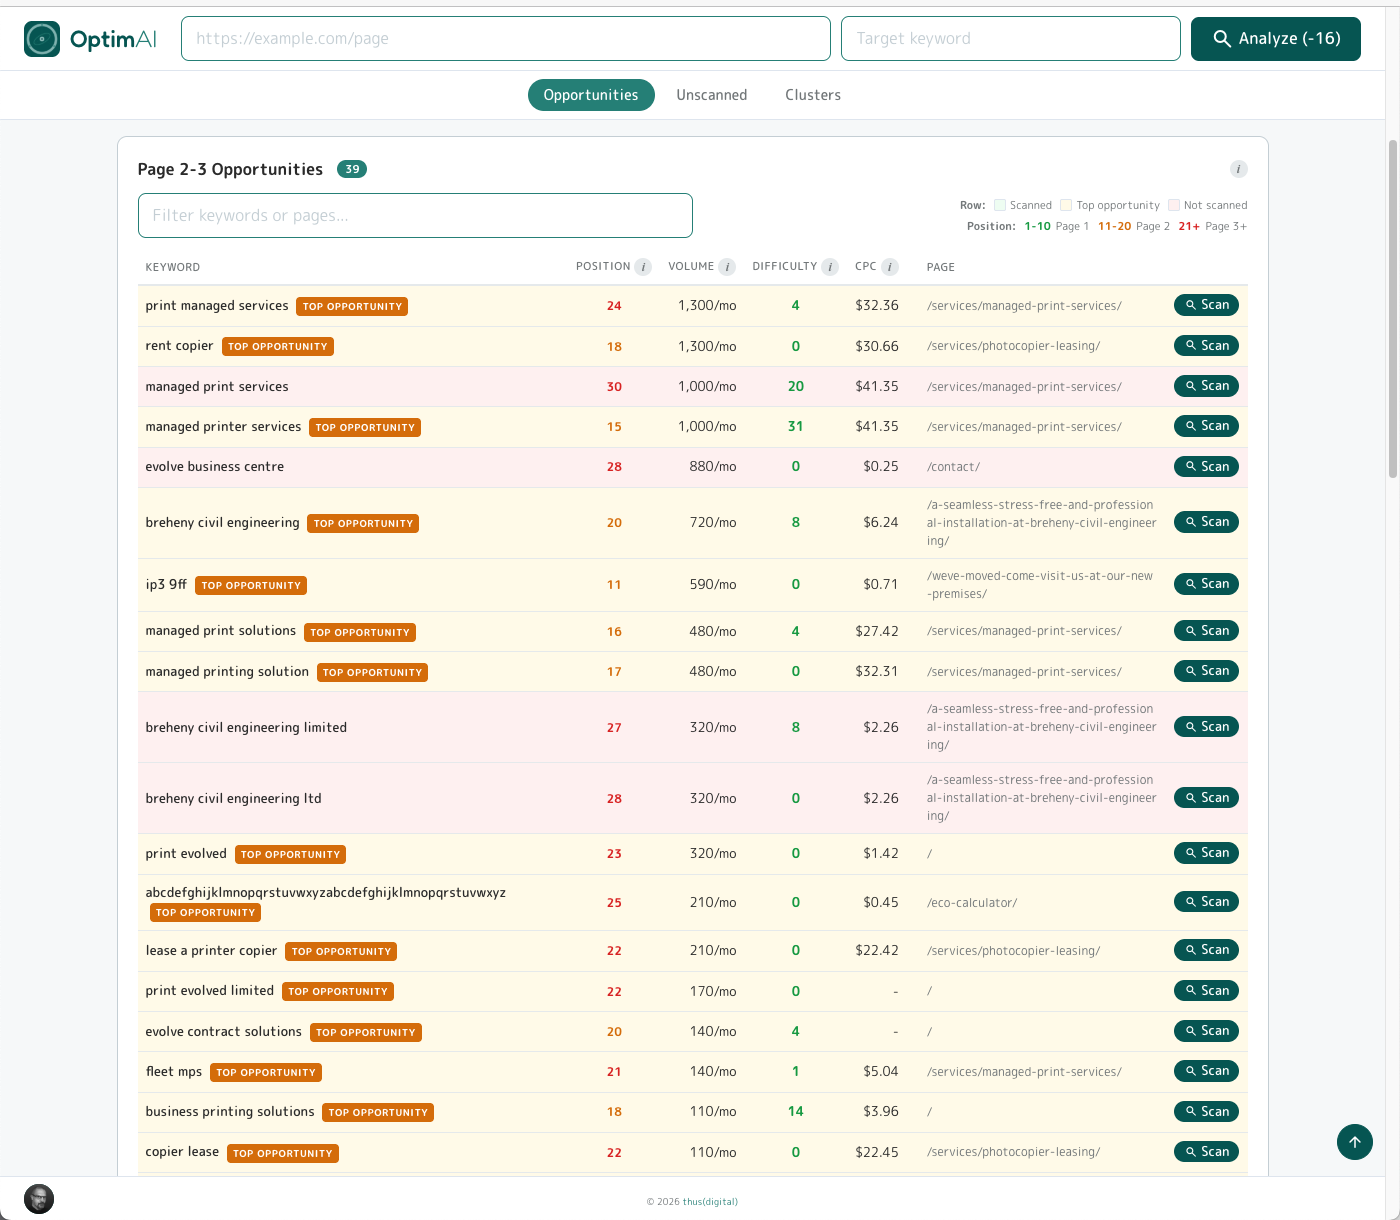
The Opportunities view lists keywords your domain is nearly ranking well for - typically sitting just outside the first page. Each row is a specific keyword + page pair: the phrase, where you rank today, search volume, difficulty, CPC and the page pulling the ranking.
Why this matters: moving a keyword from position 14 to position 4 is vastly cheaper than getting a new page to rank at all - Google already knows you for that query, you just need a targeted optimisation push. Click Scan on any row to run a full OptimAI audit for that page+keyword pair and get a prioritised to-do list for getting it over the line.
4.6.2 Site Audit - Keywords -> Unscanned
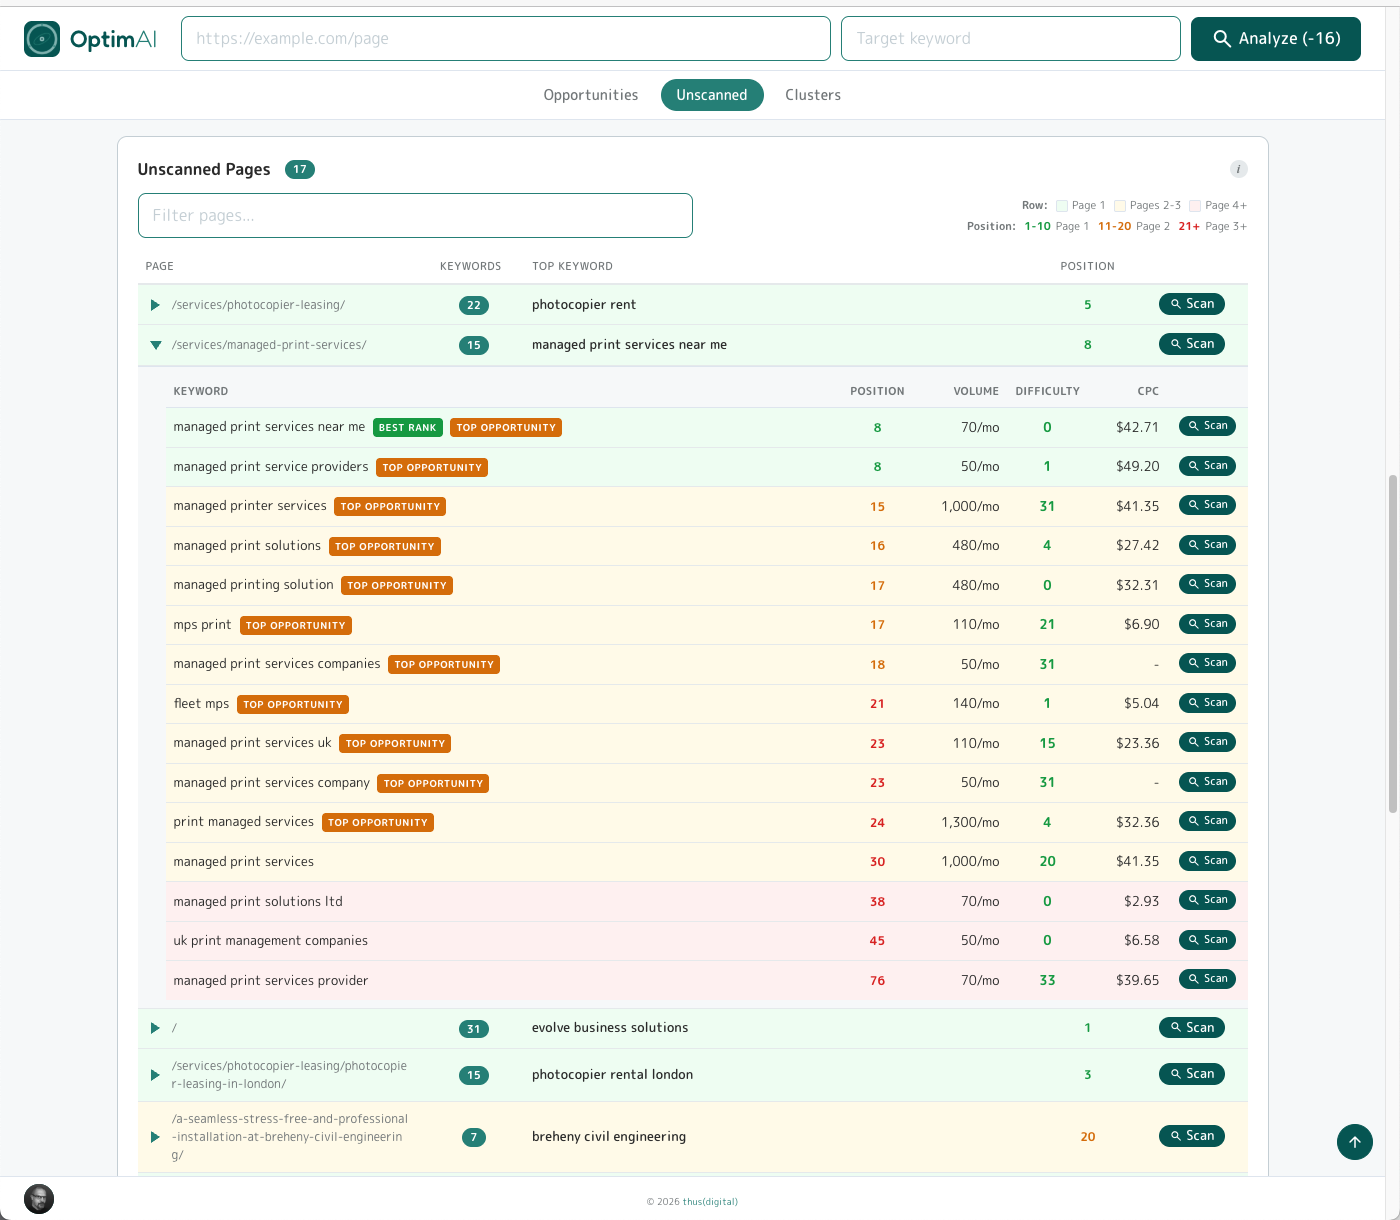
Unscanned lists pages on your domain that are already ranking for one or more keywords but haven't been through an OptimAI audit yet. Expand any row with the triangle to see which keywords that page is ranking for, their positions, and any opportunity badges attached. Click Scan to run a in-depth report and add this page+keyword combo to your optimisation workflow.
This view is where you catch the outliers - pages you'd never have thought to scan. That old blog post from 2021 quietly ranking #3 for something you never targeted on purpose. The news announcement that flukes on the exact right recipe for AI search readiness. Every domain has a handful of these accidental winners, and they're often the fastest pages to convert into genuine traffic assets once you know they exist. Picks up directly on the point in section 4.4: you don't need to scan every blog or news post to find the nuggets - this view surfaces them for you.
4.6.3 Site Audit - Keywords -> Clusters
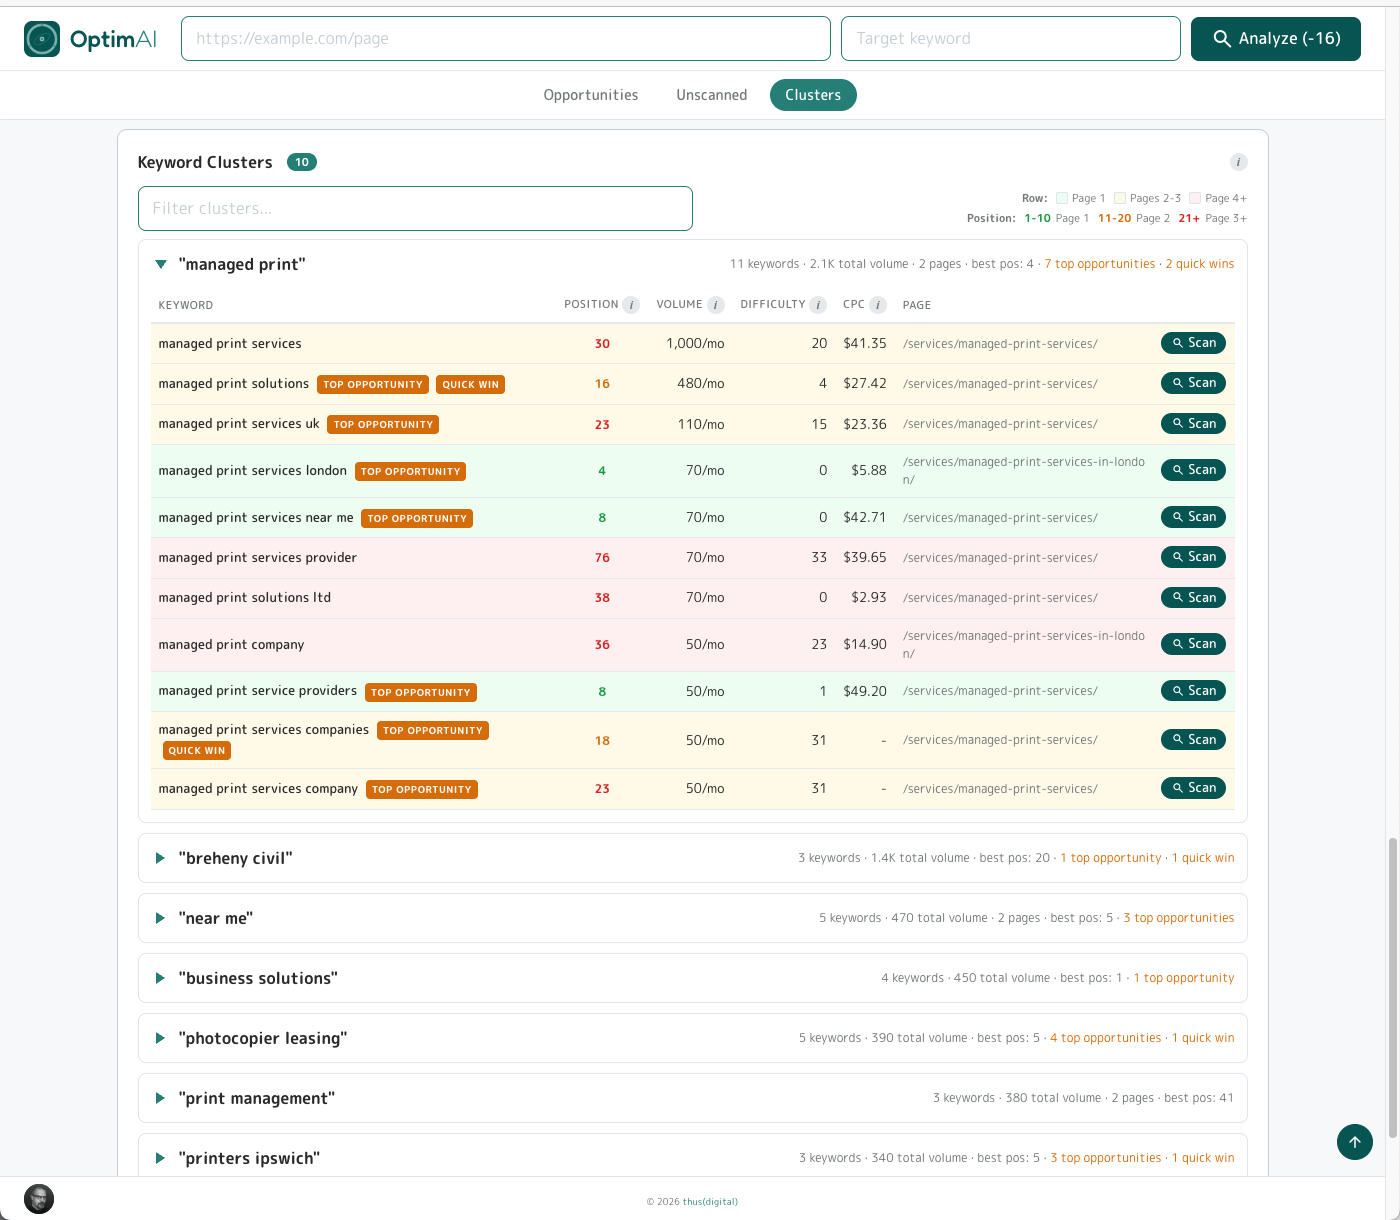
Clusters group the keywords your domain ranks for into thematic buckets - related phrases that all circle the same underlying topic. Each cluster shows its label, how many keywords sit inside it, how many pages on your site contribute to it, and the best ranking position across the group. Click the triangle on the left of any cluster to expand it and see the individual keywords, positions and opportunity badges inside.
Why clusters matter: they're the clearest view of where your domain has topical authority and where the gaps sit. A dense cluster (lots of keywords, lots of pages, strong positions) is a topic Google already sees you as credible on - extending it with a hub page or supporting article typically compounds fast. A sparse cluster hinting at demand you're barely addressing is a signal to either create new content or weave the variant keywords into existing pages for additional pull without building anything new.
Tip - two badges, two different plays:
- Top opportunity - realistic difficulty AND already within striking distance of the first page. Worth your time: scan the page, work the suggestions, push it up.
- Quick win - a narrower subset: keywords sitting just off page 1 where a small nudge often flips them over into real traffic. Lowest effort-to-impact ratio in the whole tab.
Mental model: Top opportunity = worth doing. Quick win = do this first.
4.7 Site Audit - Site Health tab
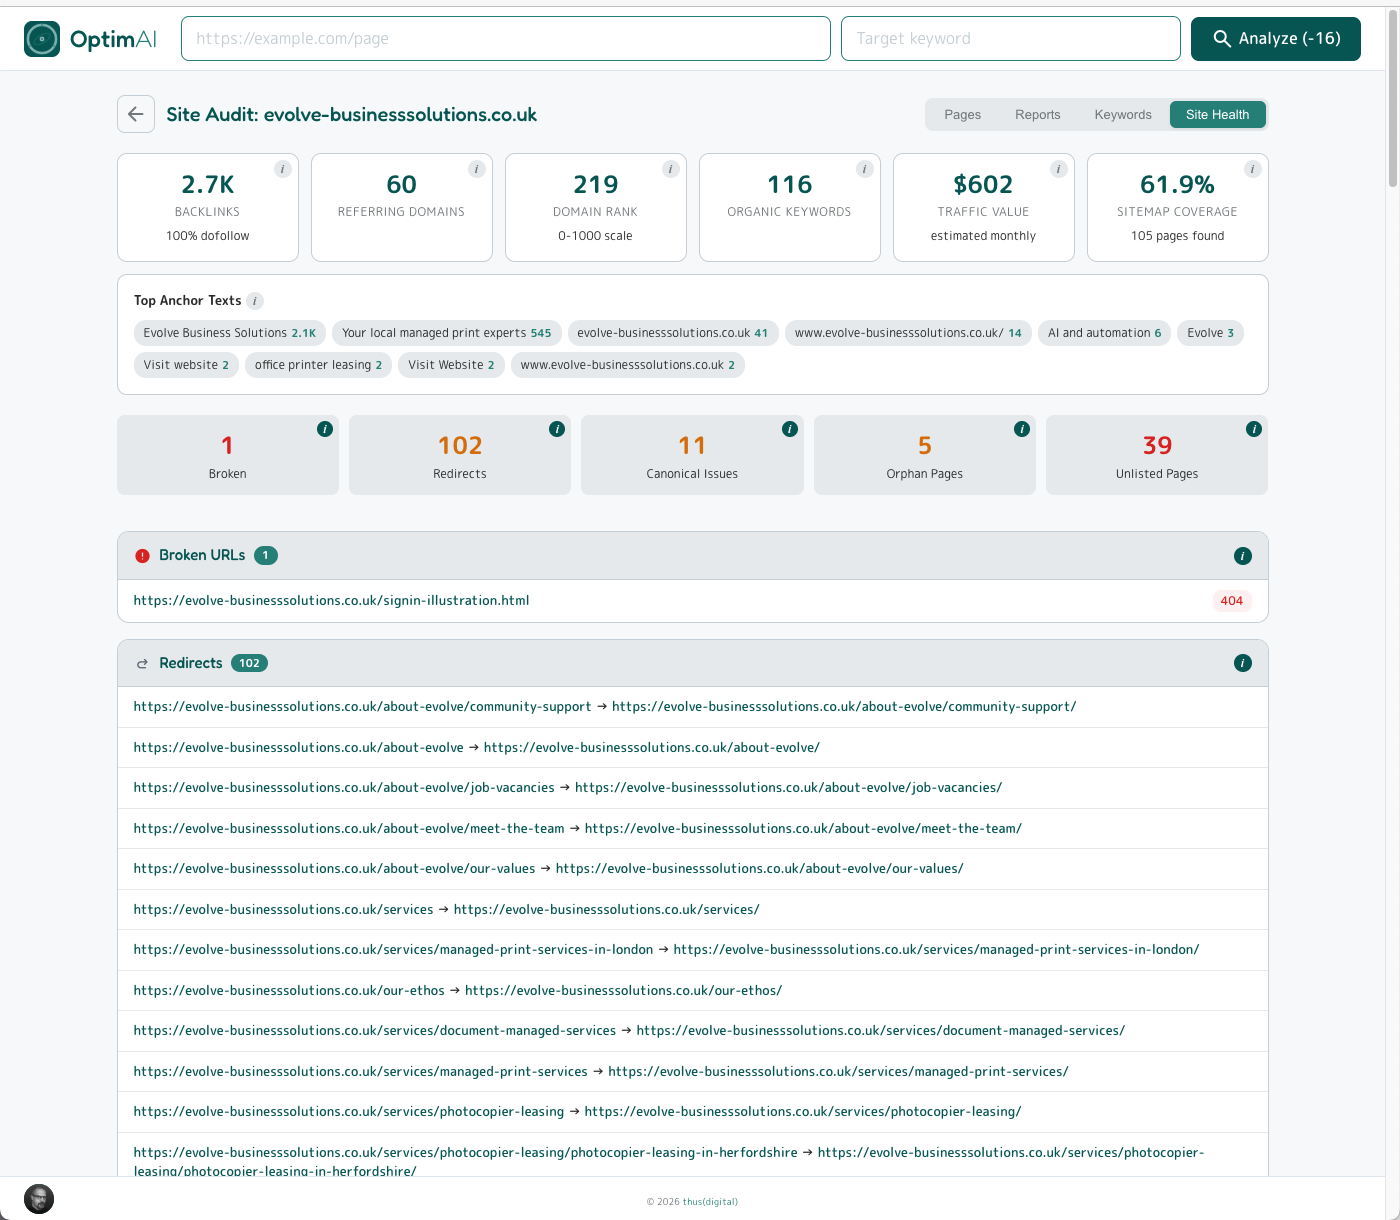
The boring hygiene stuff - but more important than most people realise. Every item in this tab is an issue quietly bleeding ranking authority, wasting crawl budget, or keeping pages out of Google's index entirely. None of it is glamorous to fix. All of it tends to be overlooked - which is precisely why it's a reliable win when you don't.
Five categories, each summarised by a count tile and expanded below into the full list of offending URLs (full tooltip on each tile if you need a refresher):
- Broken - URLs returning a 4xx error. Dead links signal neglect to both Google and users, and waste crawl budget on every scan.
- Redirects - URLs that 3xx somewhere else. Individual redirects are fine, but chains (redirect-to-redirect) leak link equity and slow page load.
- Canonical issues - misconfigured or conflicting canonical tags. Google will pick one - usually not the one you'd have picked - and split the ranking weight across the others.
- Orphan pages - pages in your sitemap with no internal links pointing to them. They exist but nothing's sending them authority, so they rarely rank.
- Unlisted pages - pages discovered by crawl but missing from your sitemap. Google may never index them - and sometimes it surfaces pages that shouldn't be live at all (stray test pages, content missing from the sitemap by accident).
4.8 Summary Reports
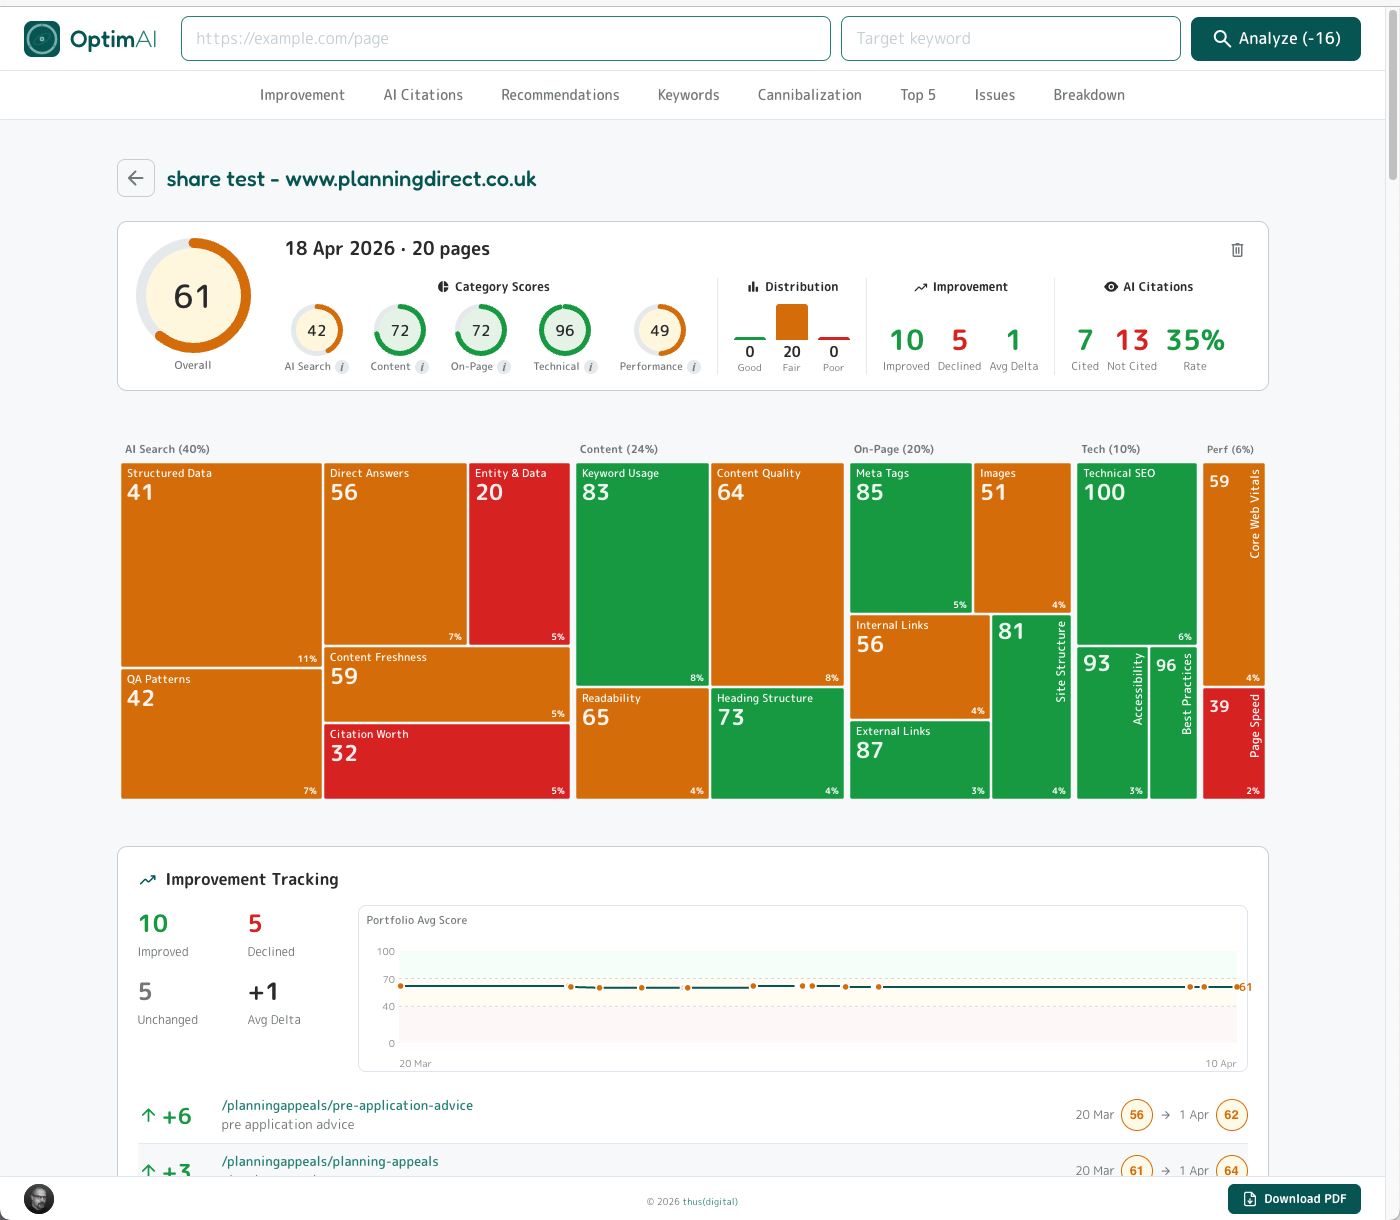
Summary reports - also called Executive Summary reports - take a whole audit (a batch of page scans, a section of a site, a client engagement) and condense it into a single scrollable page you can share, present or hand off. Every panel is an aggregate of the pages you chose when the report was generated, so the output matches exactly the slice of the site you care about.
The top panel (shown above) is the headline view: overall weighted score across the whole set, the five category gauges, a distribution bar (how many pages sit in good / fair / poor), Improvement headline stats (how many pages moved, up or down, since the previous scan), AI Citations headline stats, and the full Dimension Heatmap - this time showing the average score per dimension across the whole set, so a red tile means the set of pages included in the report is weak on that signal, not just one page.
At the top of the page is a section nav which allows you to jump directly to that section of the report, each of which we will walk through below.
4.8.1 Summary -> Improvement
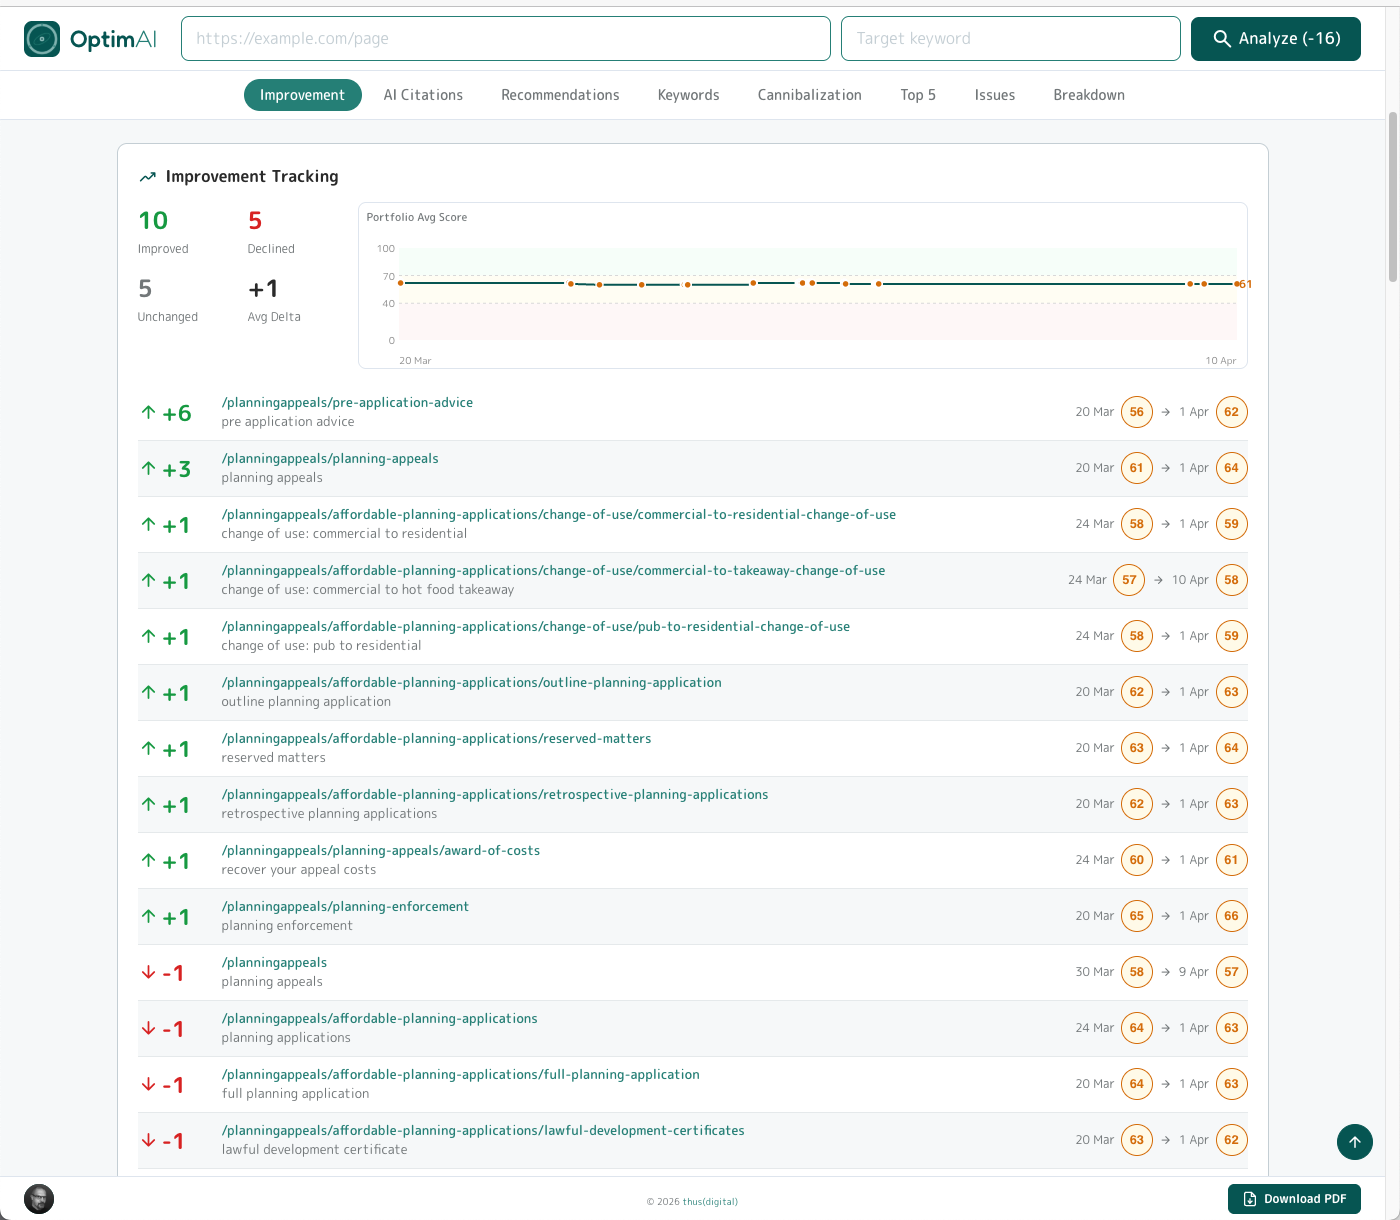
Headline stats first: how many pages have improved, declined or stayed unchanged since the last scan, and the average score delta across the whole set. Beside that, a sparkline of the page set average score over time (populated once you have more than one scan run), then a per-page list of movers with the score change per page.
4.8.2 Summary -> AI Citations
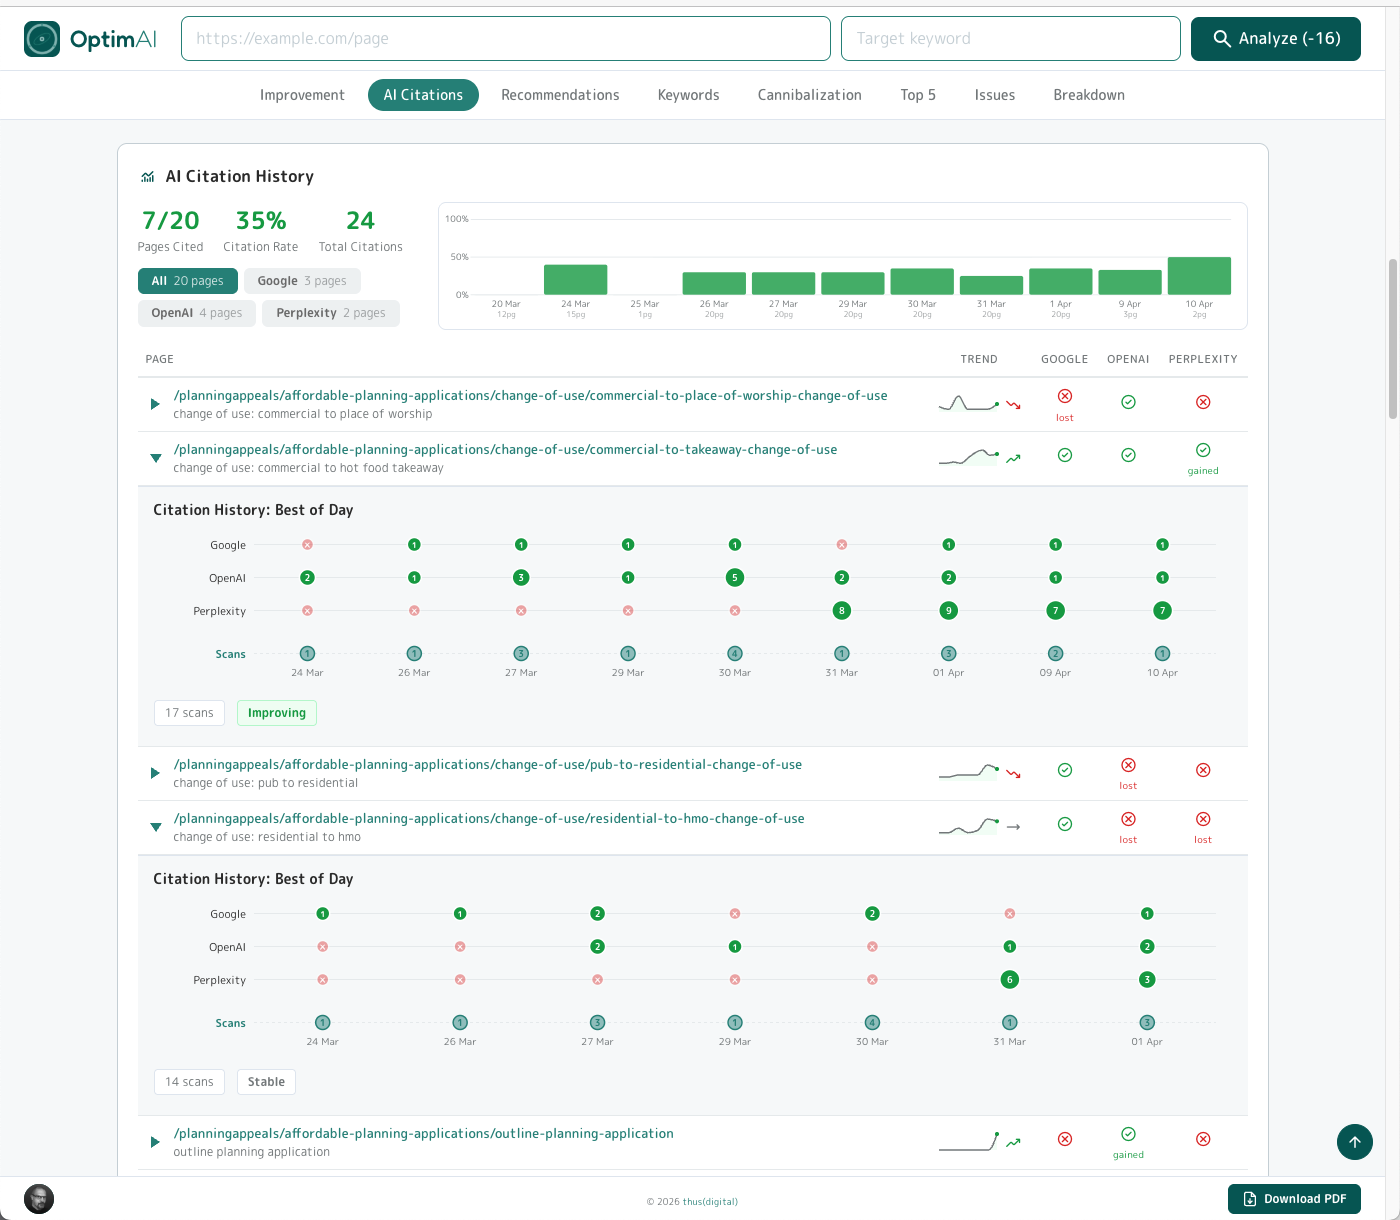
Domain-level citation intelligence across the page set. Headline stats at the top (pages cited / overall citation rate / total citations). Buttons for each engine showing total citation count which you can click to filter to Google / OpenAI / Perplexity individually. Alongside that, an average citation rate history chart shows how the rate has moved over time - builds up as you run multiple scans.
Below there's a table listing each included page with a mini citation sparkline per row, plus hit / miss / gain / loss indicators for each engine. Expand any page to see its full Best-of-Day bubble chart - same pattern as the single-page AI Search Visibility panel, so no new mental model to learn.
4.8.3 Summary -> Recommendations
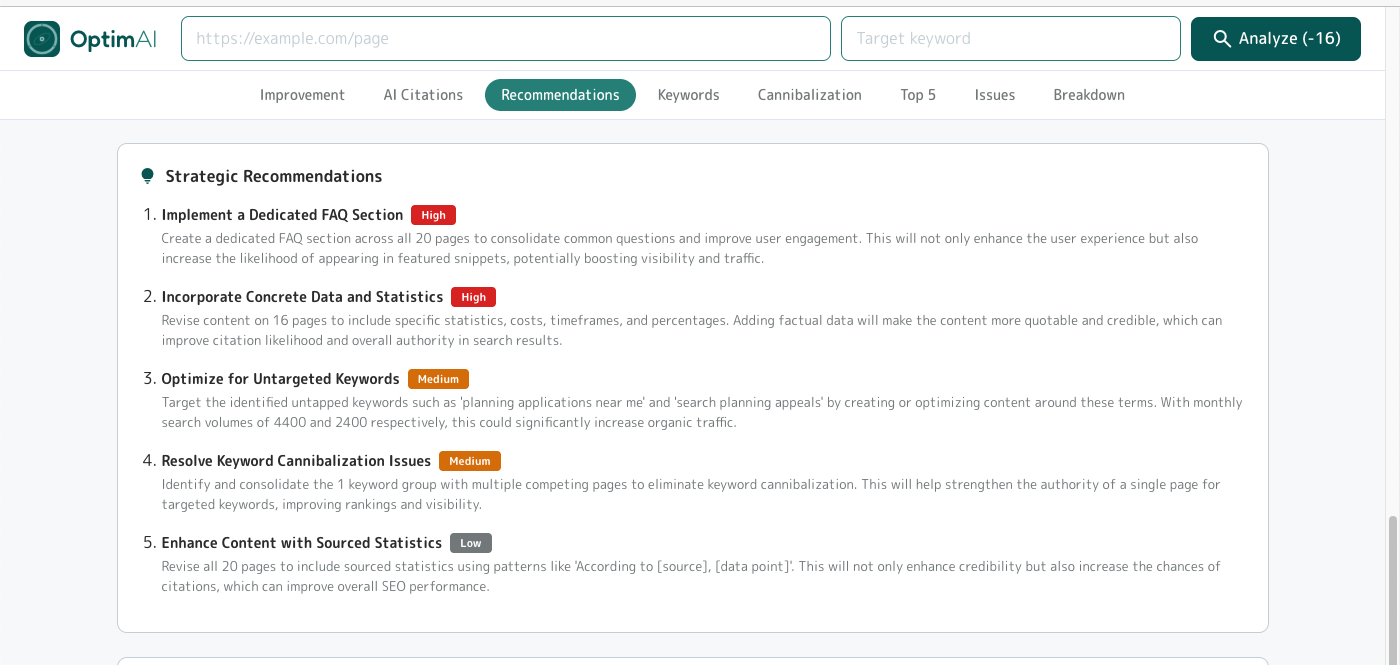
Next we've reviewed all the reports for each page and distilled this to critical strategic plays - the "if you only did five things across this whole audit" list. Each recommendation is tagged High / Medium / Low priority with a one-paragraph rationale based on the specific pages and patterns that triggered it. Hand this to whoever's briefing the next optimisation sprint - it's the executive summary of the executive summary.
4.8.4 Summary -> Keyword Opportunities
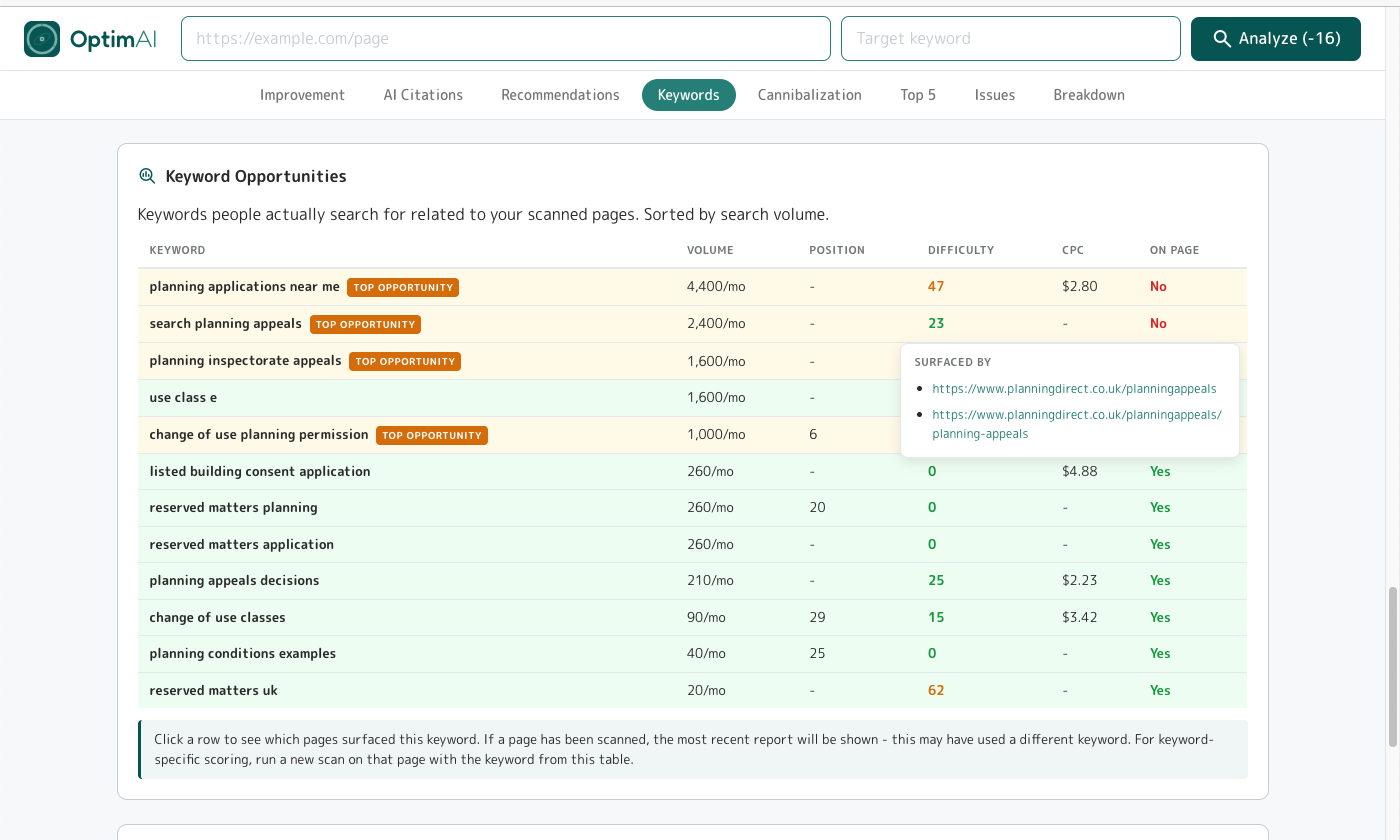
Same pattern as the single-page Keyword Opportunity panel and the domain Opportunities view - just scoped to the pages in this report. Keywords with real search demand, with the usual Top opportunity badges flagging the achievable-and-valuable ones.
Click any row for a popup that reveals which pages from the report surfaced the keyword, so you can click through to the page and run a fresh report for the new opportunity keyword on that page. This is the same "from insight to action" flow as everywhere else in the tool.
4.8.5 Summary -> Cannibalization
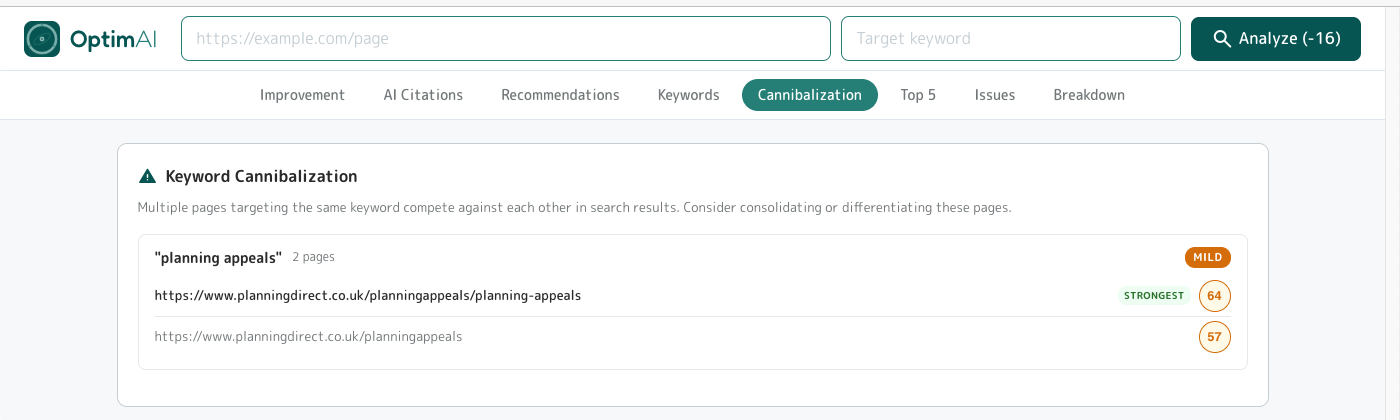
Flags cases where two or more pages in the set are chasing the same keyword and fighting each other for rankings. The severity pill (MILD / MODERATE / SEVERE) tells you how bad the overlap is; the Strongest badge tells you which page is currently winning, so you know which page to consolidate onto.
4.8.6 Summary -> Top 5
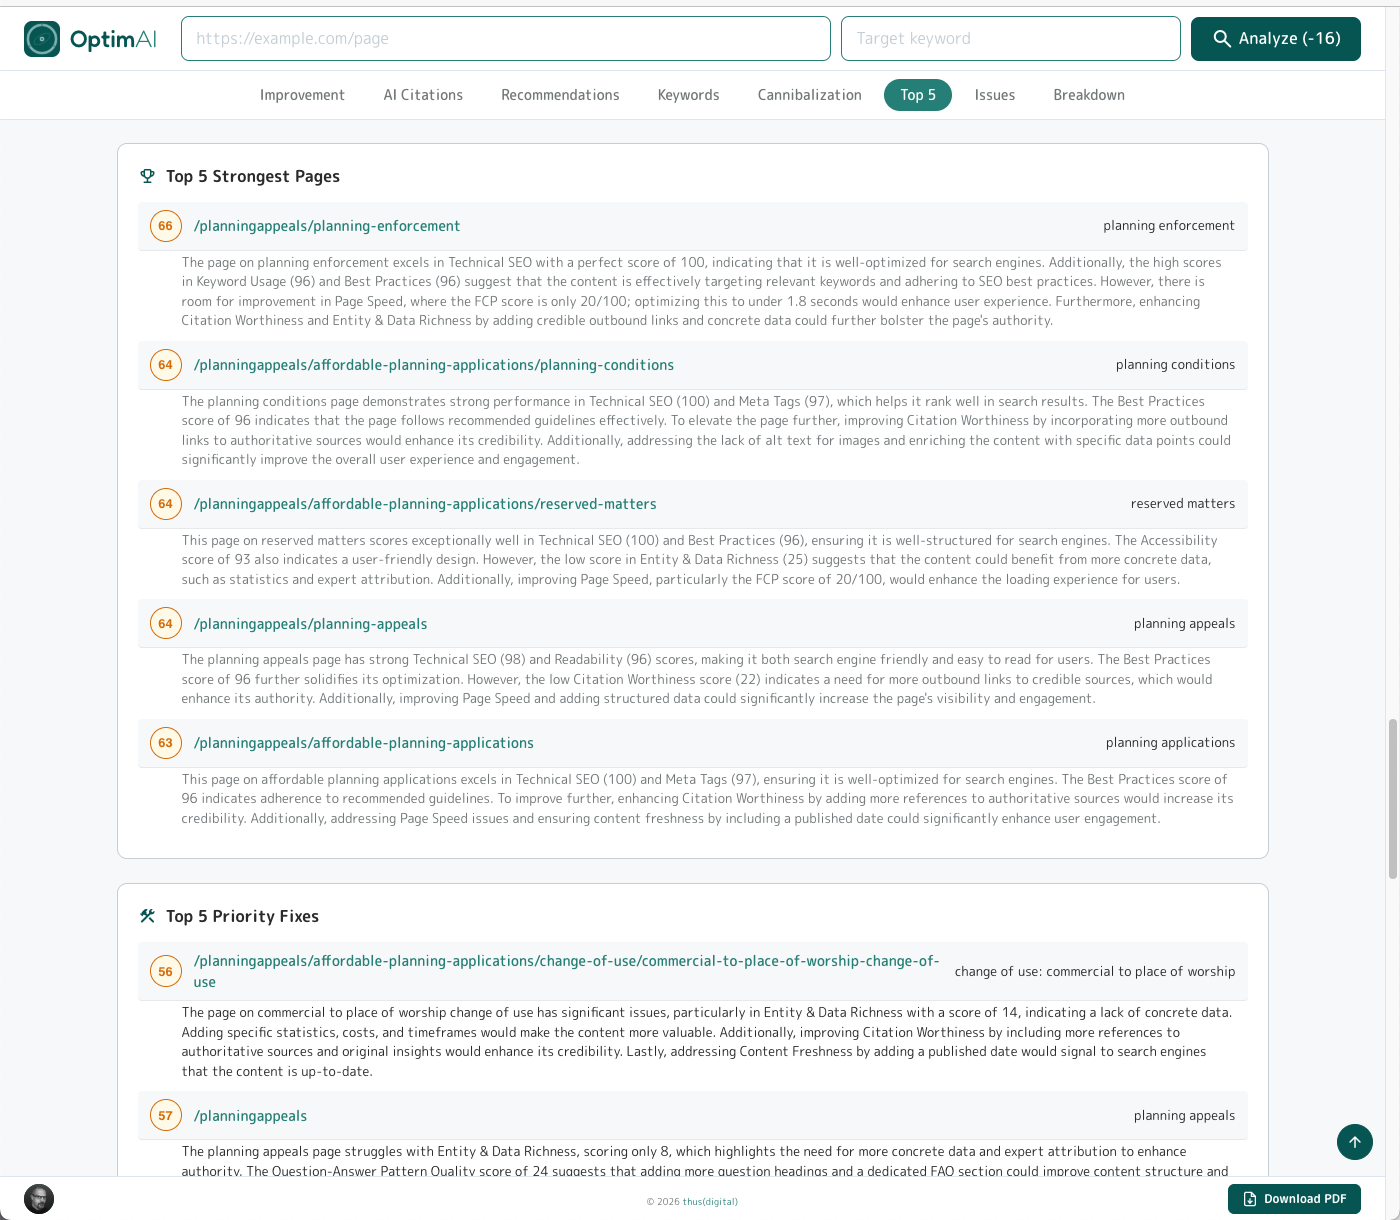
Two panels back to back in the report flow: Top 5 Strongest Pages (your current winners - the templates, content patterns and structural choices that are already working) and Top 5 Priority Fixes (the highest-impact pages to work on next, sorted by expected movement). The strongest list doubles as a brief for replication: whatever those five pages are doing, do more of it on the rest of the site.
4.8.7 Summary -> Common Issues
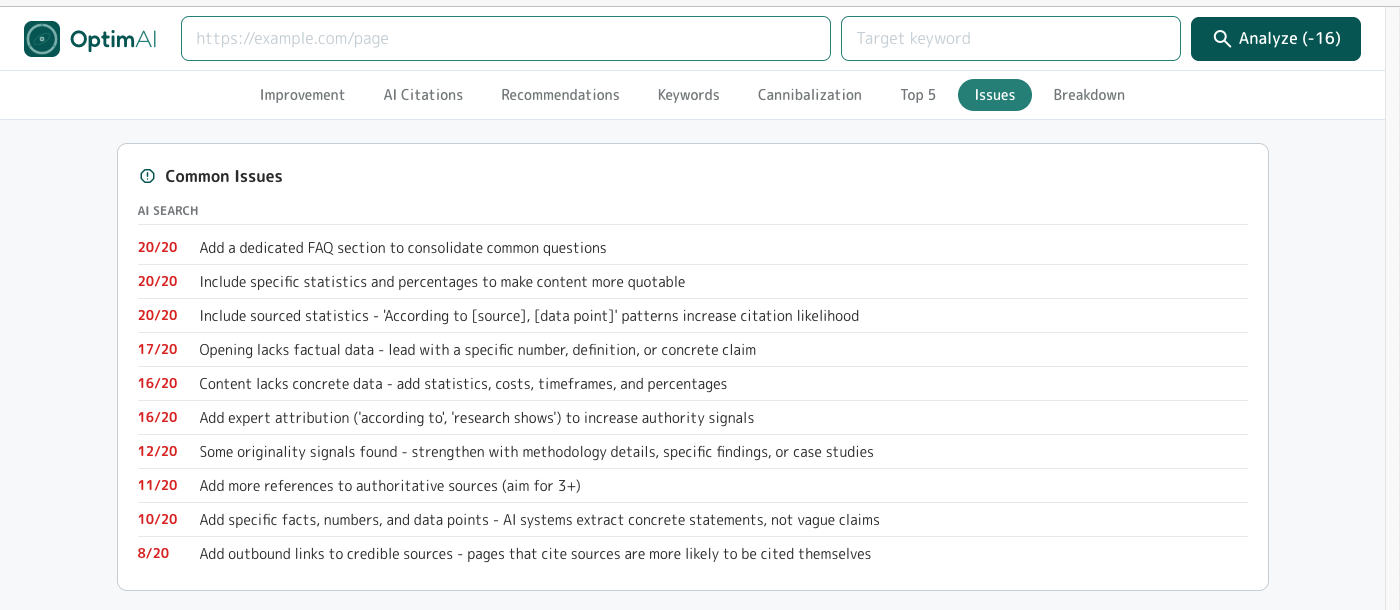
The recurring suggestions across the whole page set - issues that hit a meaningful share of pages, not just one-offs. Each row shows how many pages are affected (e.g. "20/20" = every page, "16/20" = 80%). Ordered by severity then by reach. Capped at the top 10 most significant issues and filtered to anything affecting at least 25% of the set, so it's always actionable rather than overwhelming.
The panel covers all five categories (AI Search / Content / On-Page / Technical / Performance) - in the example above everything happens to be AI Search because this particular site is strong on the fundamentals and weak on AI readiness, but the list spans the full scorecard whenever issues are spread across dimensions.
Issues surfaced here update as you fix them. Once a given issue drops below the 25% pages-affected threshold it falls out, and whatever's next most common takes its place. That turns this panel into a live scoreboard rather than a fixed report - each time you regenerate the summary after a work sprint, the list reflects what's left to do.
Tip - this is the core value prop of OptimAI: a personalised, prioritised, actionable to-do list for an entire section of your site.
Other audit tools (Semrush Site Audit, Ahrefs Site Audit - we're looking at you both) do roughly the same crawl-hygiene job our own Site Health tab does - broken links, redirects, canonical issues, orphans - plus a few hundred extra technical checks. Useful, and a fair chunk of any audit.
Where they stop is right there: a giant tracker of crawl issues for you to triage.
They don't do the per-page content + AI-search analysis that produces this Common Issues list (111 ranking metrics across 20 dimensions, run against each URL + keyword pair, then aggregated up). They don't aggregate it into a prioritised action plan. They hand you a spreadsheet and wish you luck. We hand you a sprint plan.
4.8.8 Summary -> Breakdown
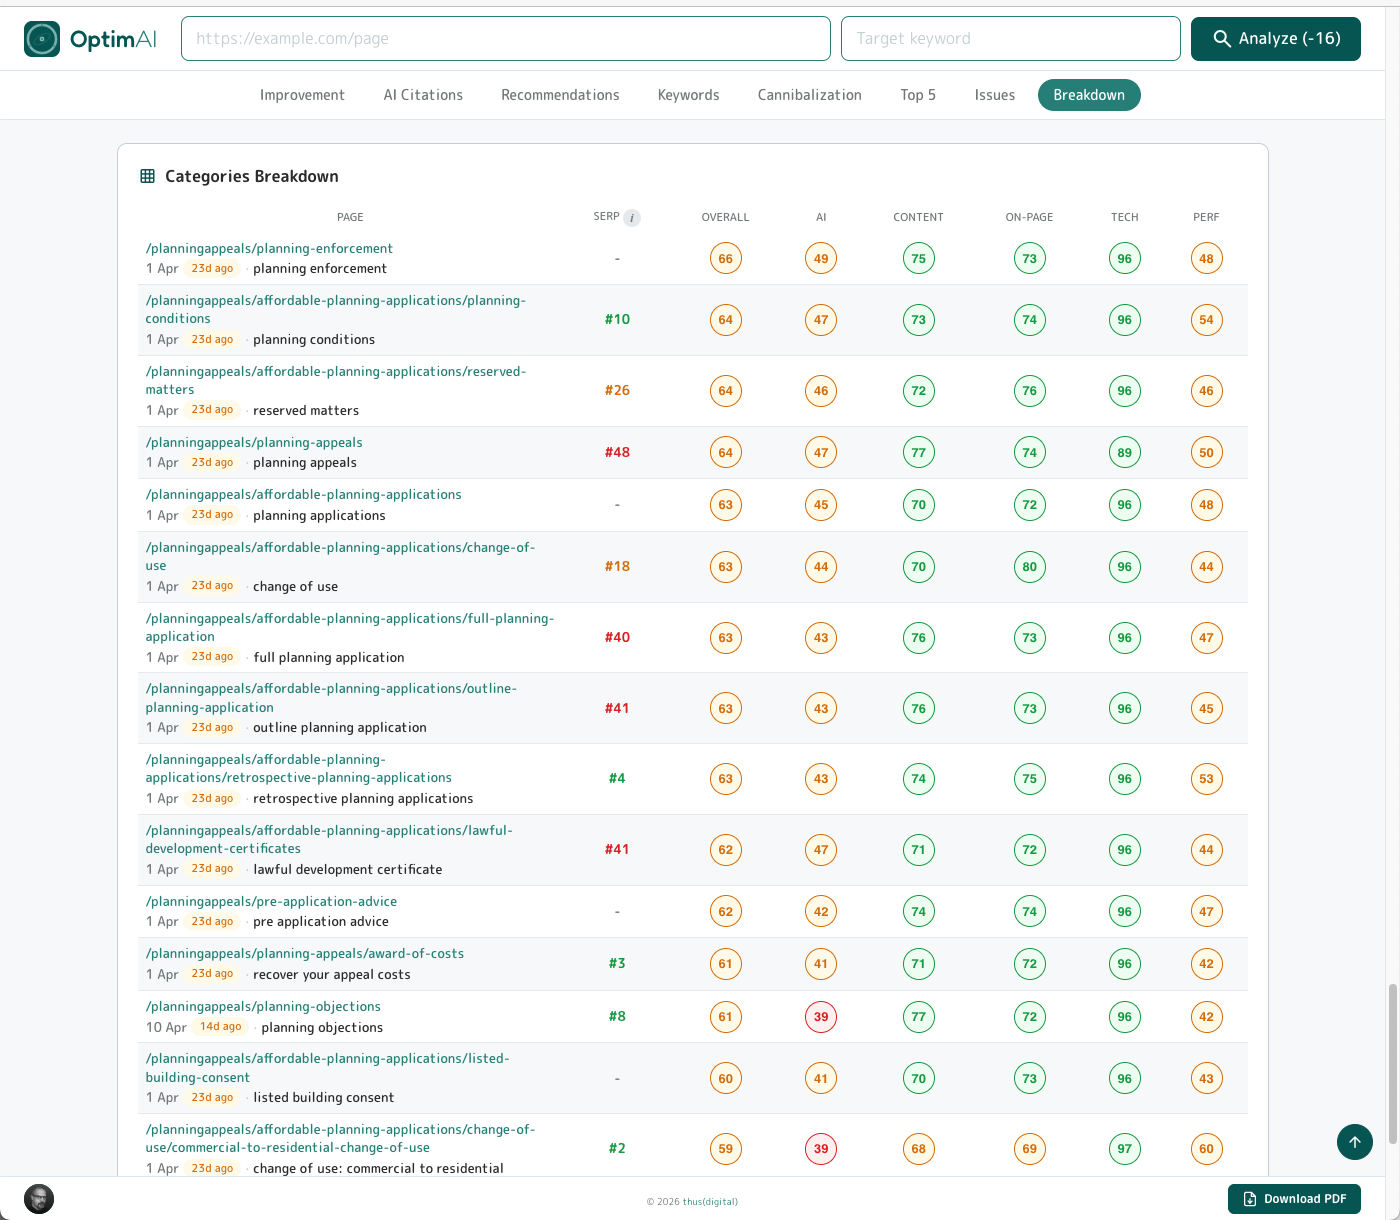
The per-page matrix. Every page in the set, with its SERP rank, overall score and scores for each of the five categories. Click any row to open the full single-page report underneath.
This is the panel for comparison over time. Rerun the summary report for the same page set each month and drop the tables side by side - the shape of the scores tells you which categories are moving and which are static, per page. It's invaluable for month-by-month client reporting: same visual, different numbers, clear trajectory.
4.9 Team Sharing (domain workspace)

OptimAI does team sharing differently: no invite flows, no seat management, no per-user billing. We use your email domain as the workspace boundary.
Sign in with your company email (alice@agency.co.uk). Anyone else signing in with the same domain (bob@agency.co.uk, charlie@agency.co.uk) is automatically part of your team.
gmail.com or outlook.com are blocked from sharing - you must use a custom "owned" domain for your business running on Google or Microsoft platforms. To be clear, you may not realise that your work email is either Google or Microsoft but in 99.99% of companies it will be - ask your IT support to confirm which if necessary. You do NOT need to set up a gmail.com or outlook.com email account to access OptimAI - and nor should you if you want to use the team sharing feature!
To enable sharing, find the Team Sharing option from the settings menu and toggle it on there.
Sharing requires 2-way consent: if members of your team have it enabled and you don't then they won't see your reports and you won't see theirs. Once enabled both ways reports are shared (per page and summaries), branding (if enabled, see below) is applied for PDF exports and your team can operate a shared credit pool.
The shared credit pool will automatically deduct credits for reports run by any team member from the account with the highest credit balance - so, for example a manager could have an account and control budget through credit purchases as desired, while other members of the team can use the tool freely within that budget limit. There is of course nothing to prevent you or other team members adding credits too, but these won't get used until all other team members have less credits on their balance.
4.10 Branding (white-label)
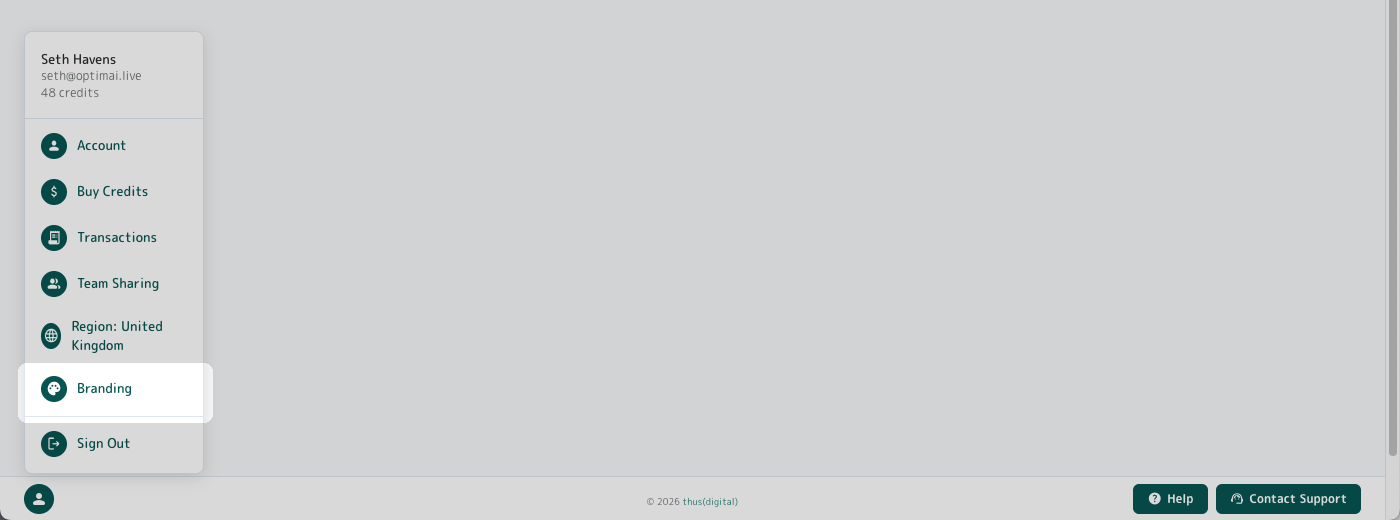
Pro users can configure a brand profile that applies to all exported PDFs - individual reports, batch reports, and executive summaries. The profile is domain-level: configure once at @yourcompany.com, every team member using that domain sees the same branded output. The first user in your company to enable and save these settings will become the "brand owner" and these settings will be locked out for other members of the team to prevent un-approved editing.
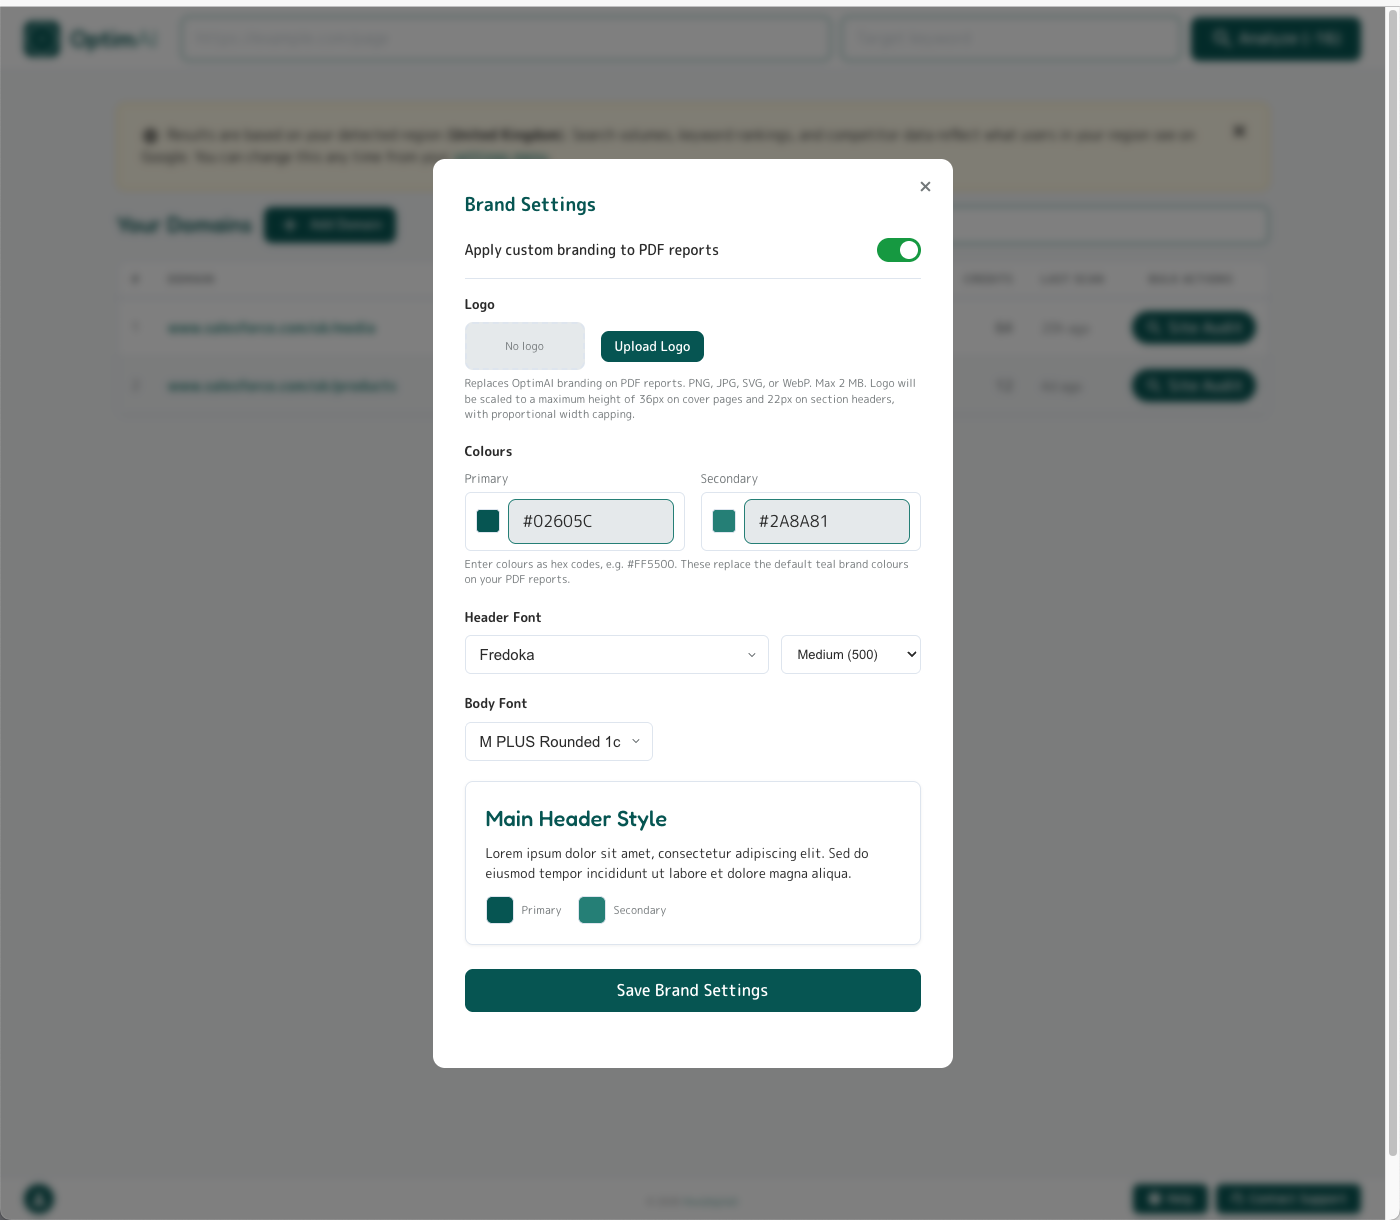
Configurable:
- Logo - PNG, JPG, SVG, or WebP (up to 2MB). Replaces the OptimAI logo in the PDF header.
- Primary colour - hex value. Scores, section headings, accent bars.
- Secondary colour - hex value. Secondary accents.
- Header font - any Google Fonts family available from the built-in font-picker.
- Header font weight (100-900) - where available for the chosen font.
- Body font - any Google Fonts family available from the built-in font-picker.
Note: the OptimAI footer will also be removed completely.
5. When to Scan
OptimAI is intended as an optimisation discipline, not just a one-off audit (though obviously you can do that if you like). The real compounding value comes from running scans on a cadence that matches the work you're doing. Run scans too often and you burn credits on noise; run them too rarely and you miss regressions. Here's a few suggestions on when and how often to scan as a working starting point.
5.1 Cadence by scenario
| Scenario | Recommended cadence |
|---|---|
| Just published a new page | Scan on publish to capture the baseline |
| Made batch of edits to an existing page | Refresh 2 weeks after deploy (Google needs time to recrawl) to capture changes (but make sure to have that baseline first to compare to!) |
| Actively optimising a high-priority page | As and when you've committed a bunch of changes during the active sprint - SERP will lag of course |
| Steady-state content | Monthly if you want to keep an eye on things, or don't bother |
| Quarterly board review | Batch-refresh every priority page so you can regenerate the executive summary with current data |
| Before a client presentation | Fresh scan of every referenced page, then PDF export |
| After a Google algorithm update | Re-scan all priority pages to see what moved and how |
| Competitor research | When you want to see what they are doing well or how you're outperforming |
5.2 AI Visibility is non-deterministic
AI engines don't always cite the same sources on the same query. A single "Not Found" on Perplexity for your keyword doesn't mean you're invisible - it could just be this run's roll of the dice. For AI Visibility specifically:
- Run at least 2-3 scans over a 1-2 week window for a reliable read
- Watch the Citation Timeline sparkline - trends matter more than single data points
- Don't re-scan mid-edit (you'll confuse cause and effect)
- For Mentioned → Cited work, fix the structure and refresh 2 weeks later so Google has time to recrawl and AI models have fresh content to pull
5.3 Chase movement, not scores
The absolute score matters less than the trend. A page moving from 47 → 68 over three months is winning faster than a page that hits 85 and stays flat. The History panel is the view to watch for this - it's the only way to tell whether your edits are doing anything.
5.4 What good looks like
Follow the signals OptimAI provides - we've carefully designed the tool to readily surface the highest-priority issues to the top. For most sites that have had at least some attention paid to SEO, when you first run a scan you'll probably end up with scores in the 45-65 range. This is normal, and in most cases it'll be because you haven't even begun to implement AI Search optimisation techniques (which OptimAI gives 40% of total score weight to, as that is the future). Don't panic.
As a general guide, you want to focus on getting the overall category scores into the green. You don't need to obsess about getting every dimension perfect, let alone every individual metric. That level of detail is really there to highlight what, if anything, is bringing down your overall score and holding you back. If you're stuck in red for FCP but the overall Performance category is 72, don't sweat it.
Remember, follow the Dimension Heatmap - it shows you which specific dimensions have the biggest impact, and those are the ones to focus on first.
Our score thresholds are set at 40 for fair and 70 for good, which we believe are honestly realistic. If you're getting red scores below 40, you really will be impacted and should sort that out. Getting over 70 is genuinely challenging, but that's precisely the level where you start to rise above the competition. Pass 80 and you're exceptional - that's the page that earns the traffic and the AI citations. It absolutely is possible to get green across the board - work through the suggestions systematically and you'll see your scores climb.
FAQ
Product fundamentals
What does OptimAI actually measure?
Each scan audits a single URL + keyword pair against 111 ranking metrics, rolled up into 20 dimensions across 5 categories: AI Search Readiness (40% of total), Content (24%), On-Page (20%), Technical (10%), Performance (6%). The scoring is deterministic - no AI in the scoring itself - and every metric, dimension and weight is visible in the report.
Does OptimAI rank my page?
No. We audit your page against known ranking factors and AI-search readiness signals, then hand you a prioritised list of what to fix. Actual ranking happens on Google. Actual citation happens inside AI engines. We measure your readiness for both.
How long does a scan take?
Around 45-60 seconds. The report opens automatically when it's done. See section 1.3 for the first-time walkthrough.
Why is the same page scoring differently for different keywords?
Every scan is scoped to one URL + keyword pair. Different keywords surface different strengths and weaknesses on the same page - keyword usage, opportunity coverage, SERP rank and AI citation behaviour all change with the keyword. Scanning the same page against multiple keywords is a legitimate and useful pattern (each one is a separate dashboard row) - covered in detail in section 2.7.
Why is my score low when the page seems fine?
Most often it's a keyword / page mismatch. A brand-hub page (e.g. /products/) won't score well for a commercial keyword like "best CRM software" because that intent belongs on a dedicated landing page. Before you fix the page, check you're scoring it against a keyword it was actually built to win. If the keyword is right, the report will tell you exactly which dimensions are dragging the score down. The Salesforce worked example in section 1.4 shows this pattern end-to-end.
How is this different from Semrush or Ahrefs?
Their Site Audit products do roughly the same crawl-hygiene job our Site Health tab does - broken links, redirects, canonicals, orphans. They give you breadth (lots of technical checks) but they stop at "here's a giant list of issues, you triage it." We go further: deep per-page content analysis, AI search readiness scoring, prioritised action plans, AI citation tracking. They hand you a spreadsheet. We hand you a to-do list.
AI Search
Does a high AI Search Readiness score guarantee AI engines will cite my page?
No. AI engines produce non-deterministic responses - their citations shift with every query, user and model update. A high score means your content is well-structured for extraction; a low score means you're effectively invisible. Think of it like dressing for a job interview: nailing the schema, entity naming and Q&A structure doesn't guarantee they cite you, but turning up in pyjamas guarantees they won't. Full detail on the readiness signals we measure is in section 3.2.
What's the difference between AI Search Readiness, Visibility and Opportunity?
Three distinct measurements, three different jobs:
- Readiness - structural: how well your page is built for AI extraction (schema, Q&A, entities, freshness, etc.). 40% of your total score.
- Visibility - live check: are AI engines actually citing your domain right now for this keyword?
- Opportunity - gap analysis: reverse-engineers what AI engines are answering for this keyword and flags what's missing from your page.
Most other tools track only one of these (usually brand-mention monitoring). Combining all three is the OptimAI difference.
Why are my AI citations bouncing between scans?
AI engines are inherently non-deterministic - the same query won't always return the same citations. A single "Not Found" doesn't mean you're invisible; it could just be this run's roll of the dice. Watch the trend, not the single number. The Citation Timeline sparkline is the right view for this - patterns over weeks tell you whether you're moving the needle, single scans don't. See section 3.3 for the full visibility view, and section 5.2 on cadence specifically for AI Visibility tracking.
Pricing & credits
How much does a scan cost?
Standard tier: 12 credits for a new analysis, 8 for a refresh. Pro tier: 16 / 10. Partner subscribers get 1.5x credits for their money - effectively the same per-scan cost as Standard while keeping all Pro features. New accounts get 120 free credits (10 Standard analyses) with no card required. Full breakdown in section 4.1.
What counts as a refresh vs a new analysis?
Rerunning a scan on the same URL + keyword combination you've already audited is a refresh (reduced credit cost). A scan on a different URL, or the same URL with a different target keyword, is a new analysis (full cost).
Do credits expire?
No. Credit pack purchases never expire. Partner subscription credits also carry forward indefinitely if unused.
What happens if I cancel my Partner subscription?
You drop back to Pro tier instantly, keep all unused credits, keep access to all Pro features, and simply pay per-pack rates from then on. We don't wipe balances on downgrade. Full Partner subscription mechanics in section 4.2.
Can I get a refund if a scan fails?
Yes. Failed scans auto-refund credits. Batch scans handle this per-page - if one page in a batch fails, just that page's credit is refunded automatically.
Pro, Team & Branding
What's the difference between Standard, Pro, and Partner?
Standard and Pro are both free tiers - neither costs anything to be on, you just pay for credits when you need them. Standard gets you per-page scans. Pro unlocks everything else: site audit, batch scanning, white-label PDFs, summary reports, domain keyword intelligence and team sharing - upgrade is one click from the settings menu, no charge. Partner is a monthly subscription that gives you 1.5x credits for the same money plus early access to new features. Full breakdown in section 4.1.
Why is my gmail / outlook account blocked from team sharing?
Team sharing uses your email domain as the workspace boundary. Generic domains anyone can sign up for (gmail.com, outlook.com, yahoo.com, hotmail.com) can't share - we'd have no way to know if you're actually colleagues. You need a custom business domain running on Google Workspace or Microsoft 365 (which is 99.99% of company email setups). You don't need to set up a separate gmail / outlook account to use OptimAI - and you shouldn't if you want sharing. Full team-sharing mechanics in section 4.9.
Who controls our brand profile?
The first user on your domain to enable and save the brand settings becomes the brand owner. Other team members on the same domain see the active branding on their PDFs but can't edit the settings - this prevents accidental edits to client-facing output. Transfer ownership via support if needed. Full branding configuration in section 4.10.
Can I share scans with people outside my company?
Yes - via PDF download. Every report exports to a clean print-friendly PDF (white-label branded if you've configured a brand profile). Team sharing inside the app is domain-locked by design (can't be cross-organisation), but the exported deliverable is yours to send anywhere.
What's the maximum site I can audit?
500 pages per discovery crawl - that's how many pages Add Domain will surface in the page tree. From there, batch scanning handles up to 100 selected pages per batch (so to scan all 500 you'd run 5 batches; the more common workflow is to pick the high-value pages and skip the rest). For larger sites, scope the discovery to a sub-path (e.g. example.com/products) and run separate audits per section. Site Audit walkthrough in section 4.4.
Edge cases & limitations
Why are some Technical or Performance metrics missing from my scan?
Some sites (typically large enterprise domains with aggressive bot protection / WAF) block external page-speed audits at the network layer. When that happens we can't measure those dimensions, so we assign a neutral score of 50 (the exact midpoint) so it doesn't pull your overall score up or down. The metric breakdown for those dimensions won't render. The same fallback applies to login-gated pages and pages that hide their content behind heavy JavaScript - both are detection-resistant by design. See section 3.7 and section 3.8 for the affected categories.
Can I scan a page that requires login?
No. OptimAI fetches pages anonymously, so anything behind a login wall isn't visible to us - or to Google, or to AI engines either, which is the bigger point. If your most important content is gated, that itself is the SEO problem.
Can I scan JavaScript-heavy or single-page-app sites?
Best-effort. We fetch the rendered HTML of the page, but pure client-side-rendered content (React / Vue apps with no server-side rendering) may not be fully parsed. Affected dimensions get the same neutral fallback as login-gated content. If your site is SPA-only, the fix is server-side rendering or static generation - not just for us, but for every search engine and AI crawler.
Does region affect my scan results?
Yes. Search volumes, keyword rankings, SERP composition and competitor data all reflect the region your account is set to. We auto-detect region from your IP, but you can override it from the settings menu. Set region before you scan - existing scans stay tied to the region they were run under. Region picker covered in section 2.6.
Do you support other languages?
English only at launch. More languages coming post-launch based on demand.
Data & privacy
Is my scan data shared with anyone?
Only with teammates on the same email domain, and only if team sharing is enabled on both sides (see section 4.9). We never sell or share scan data with third parties.
Do you keep my scan history forever?
Yes - lifetime history. We don't delete, archive or expire scans. The History panel and dashboard show every scan you've ever run. Storage is negligible and the data feeds the trend views that make optimisation work meaningful over time.
Can I delete my account or scan history?
Account deactivation is self-serve from the Account modal - your scan history and credit balance are preserved if you want to reactivate later. Full deletion of historical scan data is available on request via the contact form below.
Workflow & cadence
How often should I rescan a page?
Refresh after making edits to verify the fix landed - 2 weeks after deploy if you want SERP / ranking signals to update too (Google needs time to recrawl). Otherwise monthly is plenty for steady-state content. The full cadence guide is in Section 5.
Can I scan competitor pages?
Yes - it's a legitimate competitive-intelligence move. Same per-page model. Scan a competitor's top-ranking page against your target keyword to see exactly how they're winning structurally; the gap between their score and yours is your roadmap.
Does the Action Plan persist between scans?
Yes. Suggestions update progressively as you fix them - resolved items are tracked, items that come back show a "Needs Work" badge, brand-new items get a "New" badge. The list is a live to-do board across the lifetime of the page, not a fixed snapshot.
Can I export my data?
Yes. Every individual report exports as PDF (with white-label branding on Pro). Pro accounts can also export the site audit page tree to Google Sheets for keyword strategy planning, and download zipped batch PDFs for the entire selection in one click.
Contact Support
Got a question, a bug to report, or a feature request? Send us a note. We reply from a real inbox, usually within a working day.